Polkadot attempts to breach key resistance but can it succeed in…

The $55 highs of November were aggressively sold off in the weeks since, and the $23.4 level was tested multiple times in recent weeks. Technically, Polkadot was within a buy zone, but any buys with a mid to high-term time horizon have to be carefully managed. Bitcoin could see a bounce but the structure remained bearish, and this could negatively affect Polkadot as well.
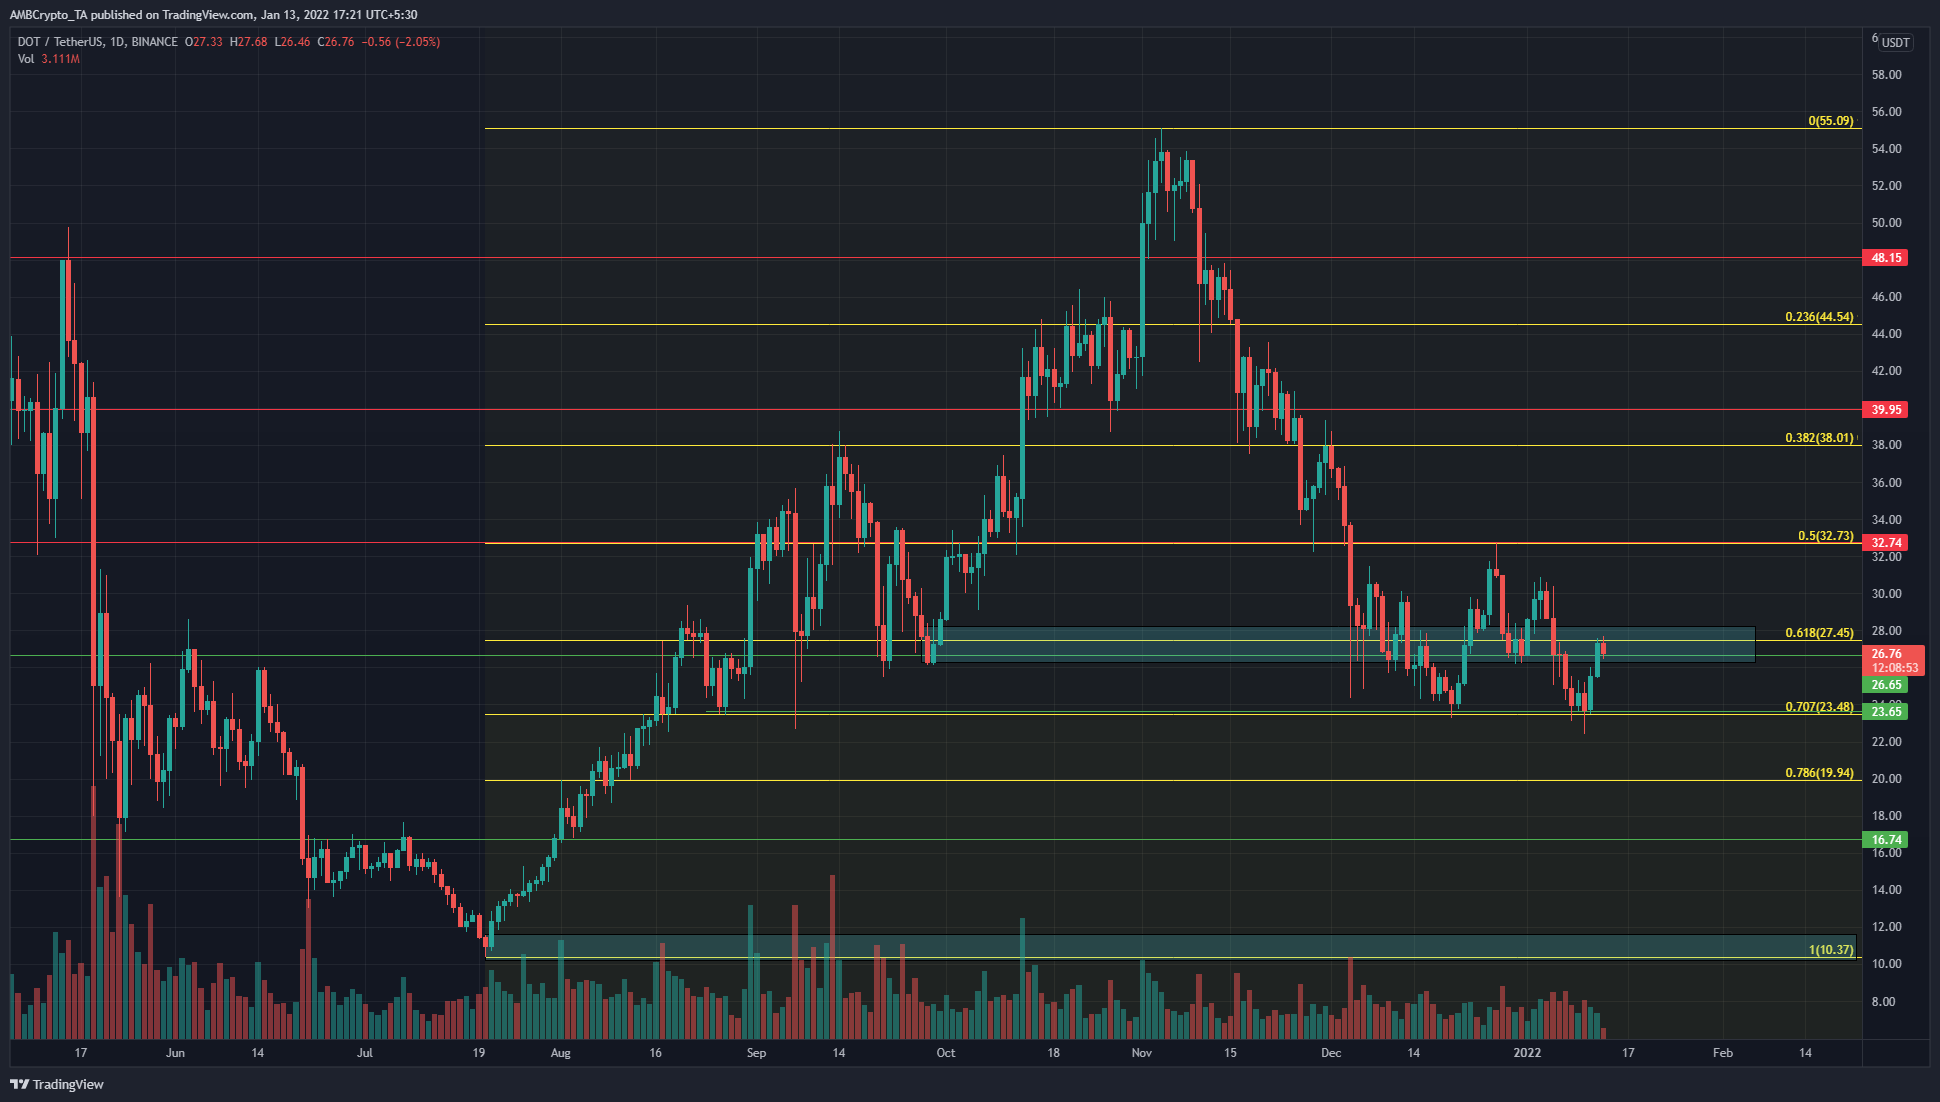
Based on the move from $10.37 to $55.09, Fibonacci retracement levels (yellow) were plotted. The 61.8%-78.6% retracement levels are places where investors look to buy an asset at. DOT has experienced some support at the 70.7% retracement level, but the $26.7 area (cyan box) was likely to be flipped to supply once more.
Each test of an area by the price weakens the wall of bids or asks in the area. In early September, a large wick to $23.4 was rebuffed. Similarly, recent weeks have seen buyers step in at this level, but a series of lower highs were established. This meant sellers were getting more confident fading the bounces, a sign of seller strength.
It appeared likely that $23 could be tested once more in the days or weeks to come, and it could drop further to $19.9.
Rationale
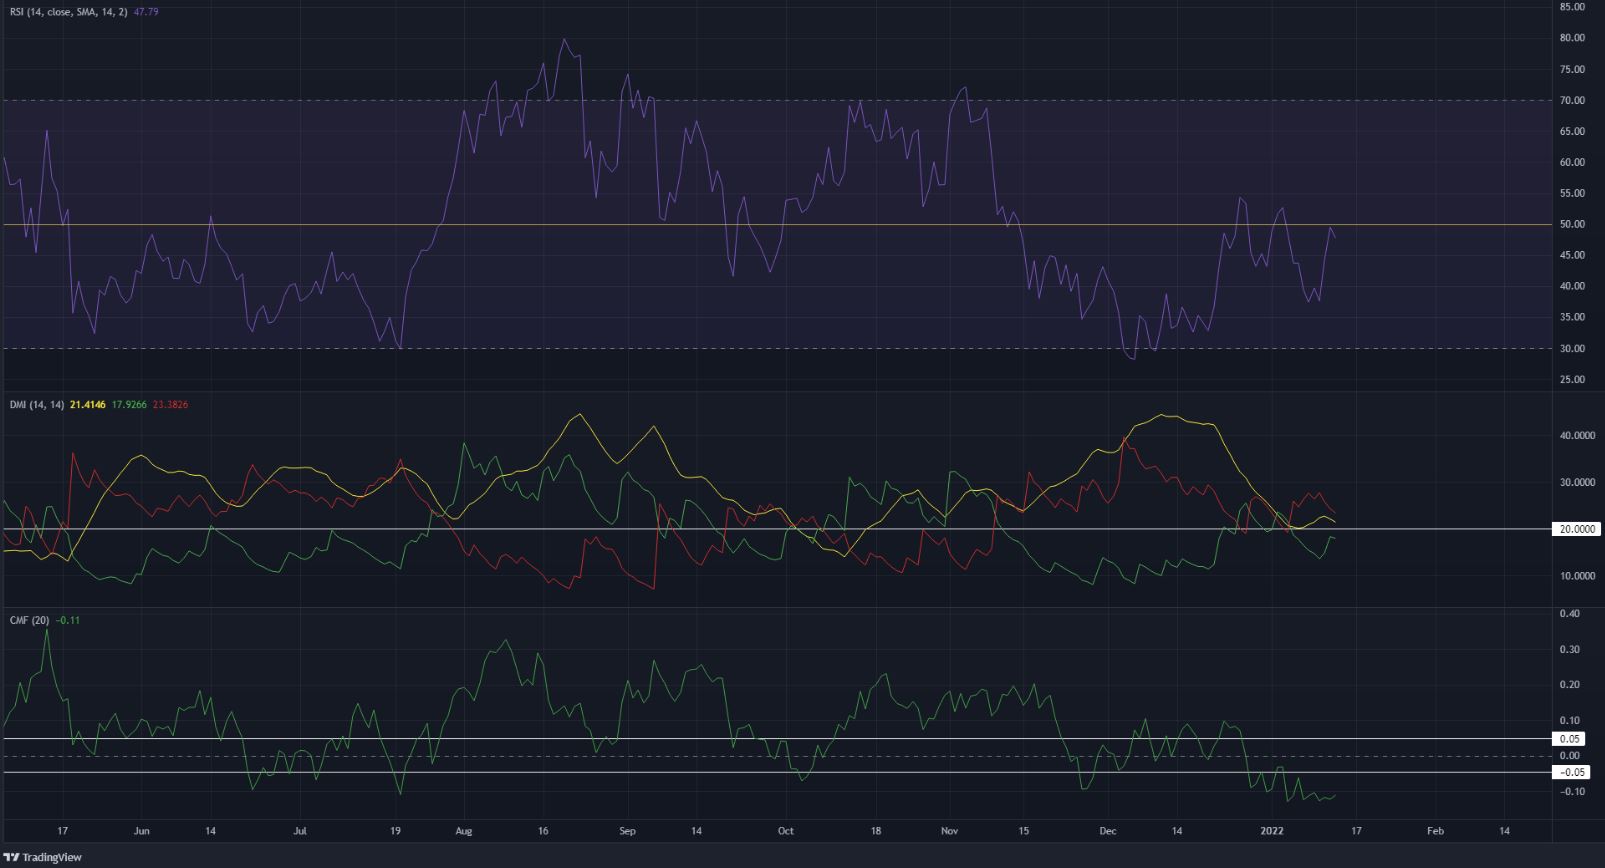
The RSI has been below neutral 50 since the price slipped below $40 in early November, indicating the onset of bearish momentum. Over the past few weeks, the CMF has also been below -0.05 to show capital flow out of the market.
The Directional Movement Index also showed a significant bearish trend was in progress, although it was weakening. This could be because the price has oscillated between $23.4 $27.4 in the past few days.
Conclusion
Polkadot did not look healthy on the daily chart. Sometimes, these are the kinds of charts that offer a high risk-to-reward buying opportunity. However, a more risk-averse investor can wait for a flip of the $32 level from resistance to support. Such a move could confirm that DOT was on its way toward recovery. In the event that DOT dropped below $23.4 in the coming weeks, $19.9 and $16.7 are likely to be support levels.