Polkadot’s divergence sees DOT slip back beneath this support level

Disclaimer: The findings of the following analysis are the sole opinions of the writer and should not be considered investment advice.
Polkadot has been on a higher timeframe downtrend. This downtrend began in early April. Before that, the time period from November to late February also saw Polkadot post heavy, consistent losses. In March, a rally was seen, but this rally did not initiate a longer-term uptrend.
Bitcoin also struggled to hold on to the psychological $20k mark. A deeper dip could send DOT plunging down the charts as well.
DOT- 12-Hour Chart
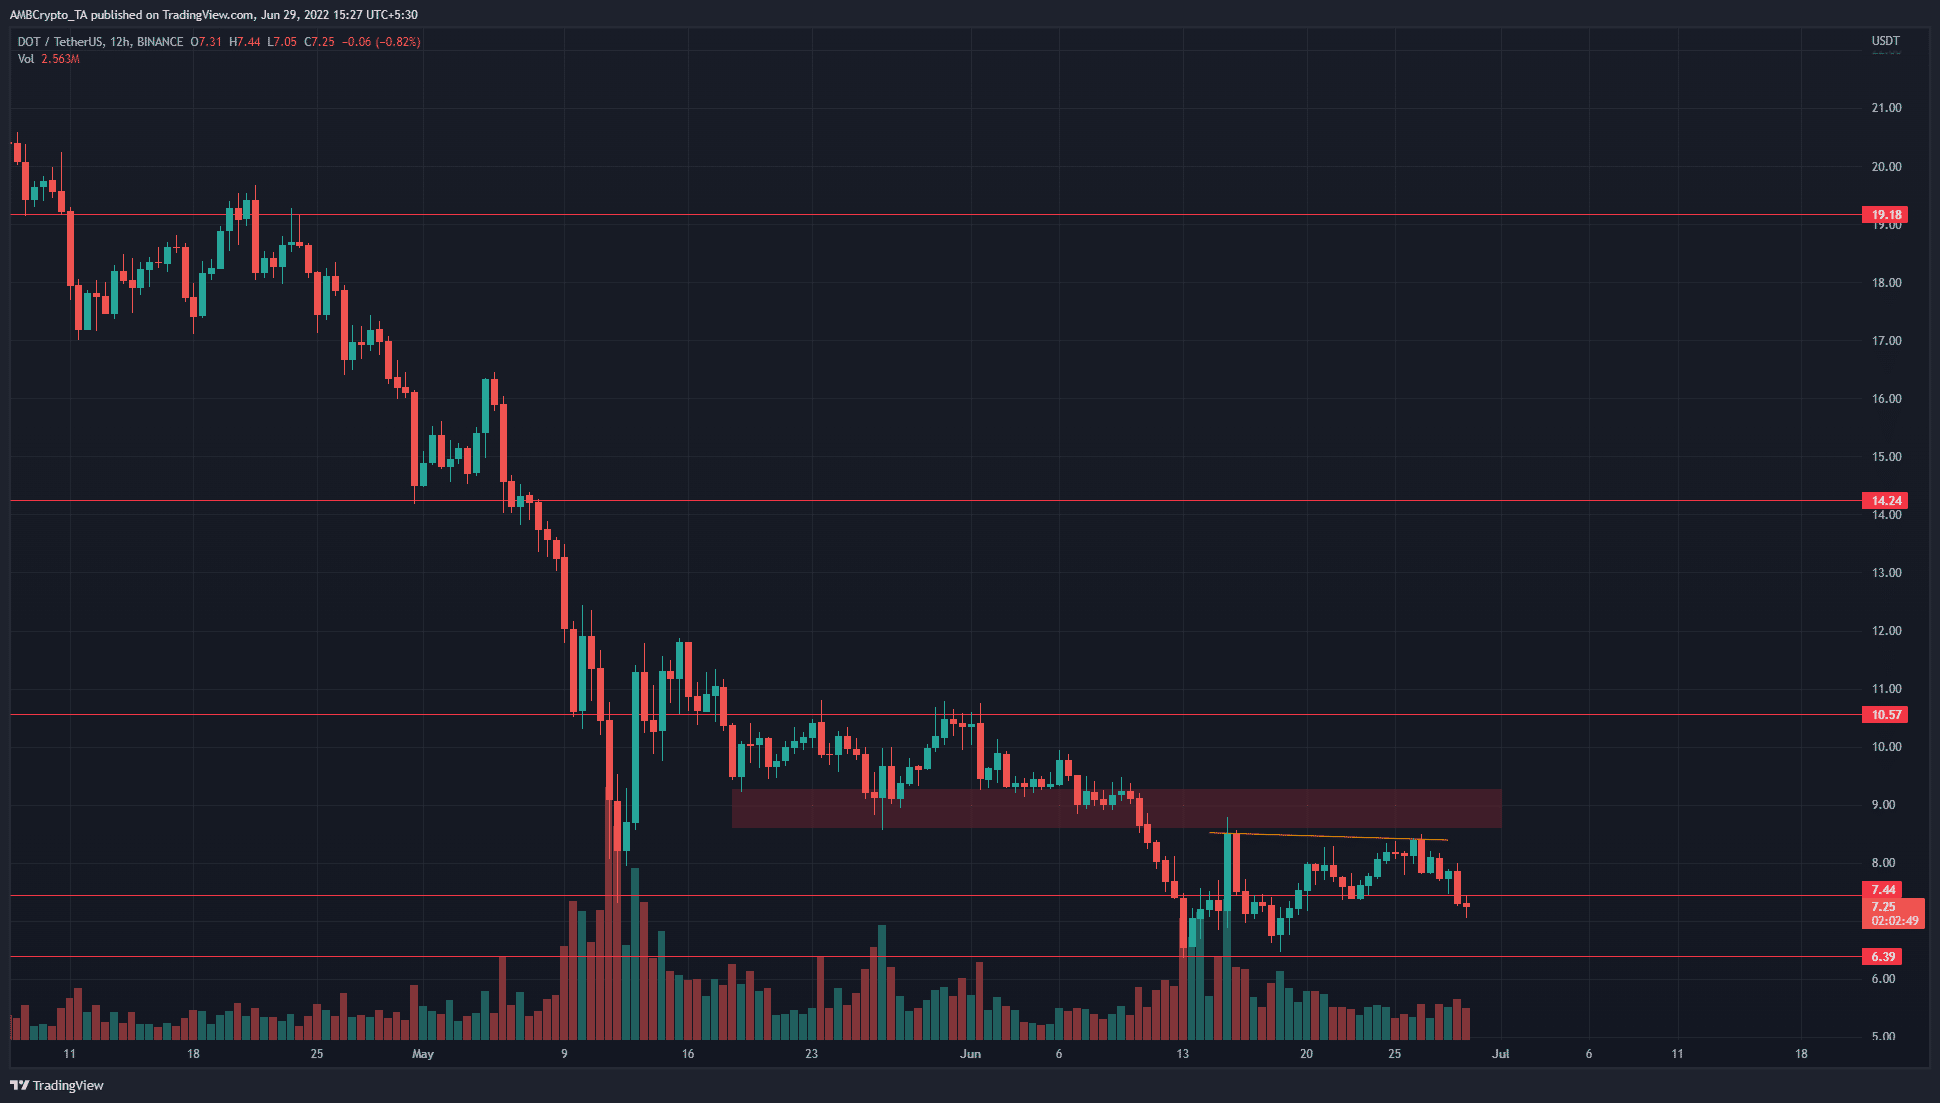
In April and May, wave after wave of relentless selling pressure saw Polkadot drop from the $23 resistance level, all the way to the $7.44 support. In May, the price was able to claim the $9 area as support, but couldn’t push past the $10.5 resistance.
The second week of June saw Bitcoin slip beneath the $28k area, and Polkadot also lost the $9 support zone. The $7.5 and $6.4 levels have acted as support in the past two weeks.
As DOT bounced to retest the $9 zone of former demand, a hidden bearish divergence (orange) between price and momentum (RSI) was seen. Following this development, the price dropped back below the $8 mark.
Rationale
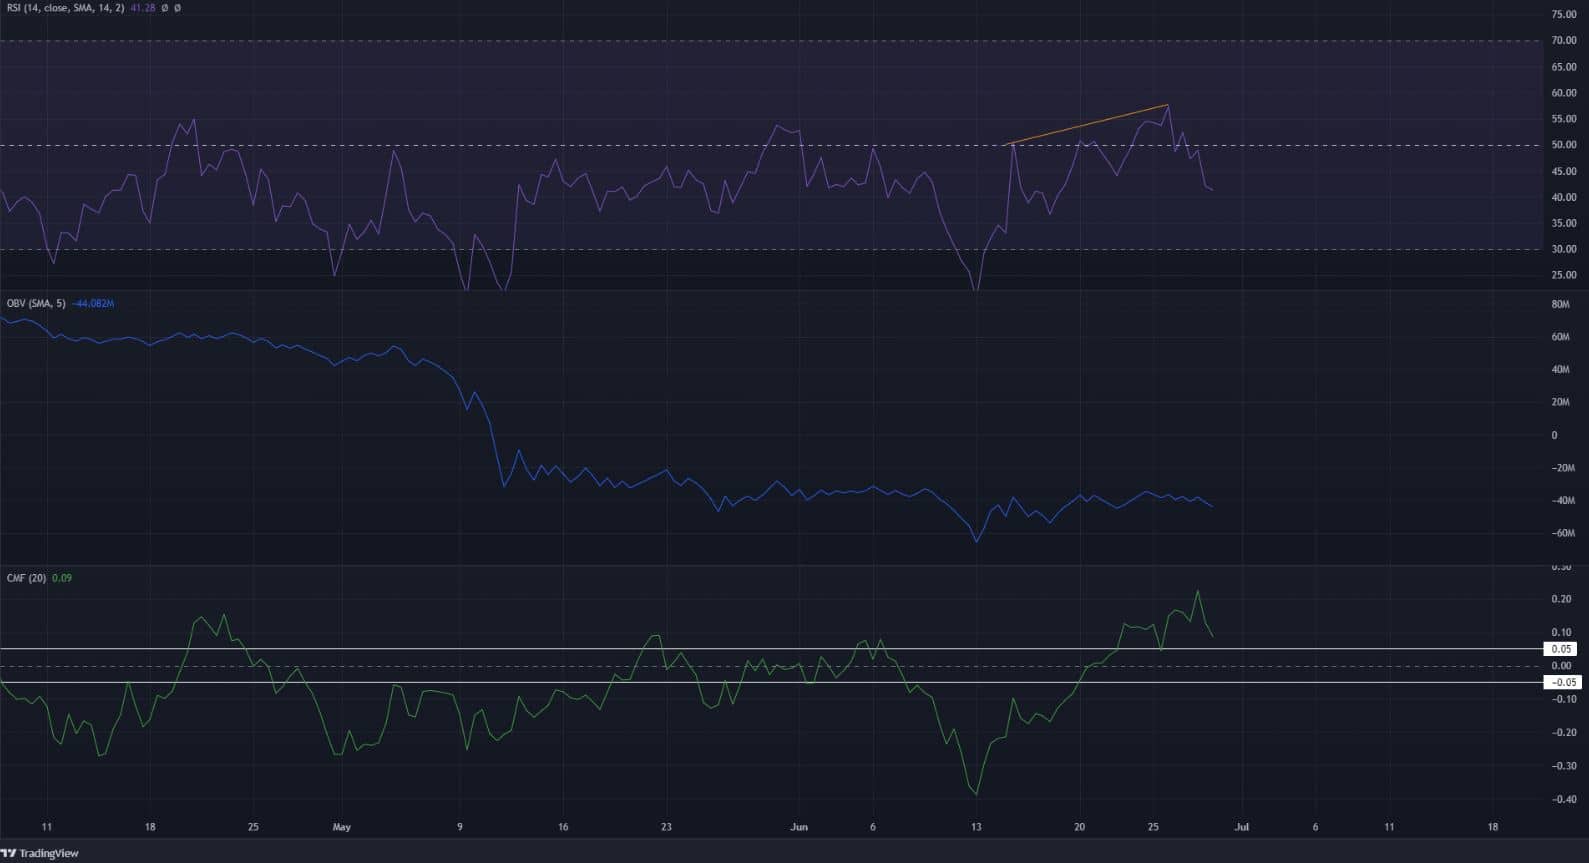
The RSI has attempted to rise back above the neutral 50 line in the past two weeks. Each of the three attempts took the RSI higher. At the same time, the price formed lower highs and signaled a hidden bearish divergence on two occasions in the past week.
The most recent one saw DOT post losses of nearly 15%. Moreover, the development of the hidden bearish divergence suggested that the downtrend could be set to continue.
The OBV was also struggling to push above the series of nearly equal highs it set in recent weeks. This failure hinted at a lack of buying power. Even though the CMF has been above +0.05 in the past week, it might not signal a trend reversal.
Conclusion
If the CMF falls back beneath the -0.05 mark, it would add evidence to the already bearish outlook that Polkadot has on the charts. The indicators showed that momentum was back in favor of the sellers, and the OBV showed that the buyers lacked strength. Another move to $6.4-$6.5 could be close.


