Polkadot, Ethereum Classic, SUSHI Price Analysis: 02 July

The altcoin market has mirrored Bitcoin’s downtrend since late June. Altcoins like Polkadot, Ethereum Classic, and SUSHI noted bearishness, despite the fact that there was some buying pressure too.
Polkadot [DOT]

Source: DOTUSD on TradingView
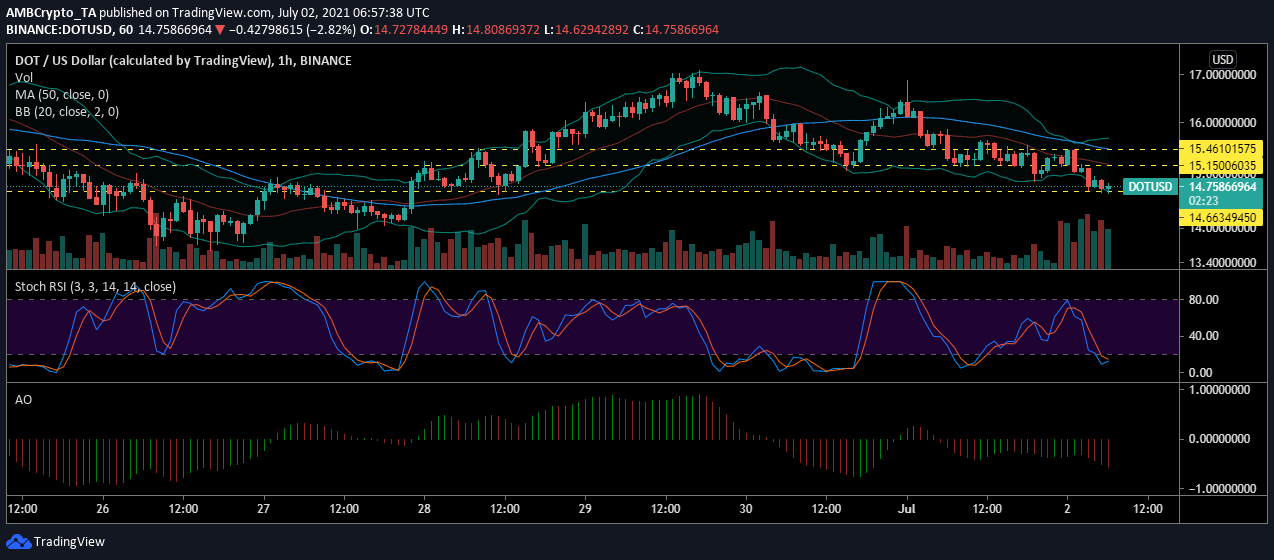
Polkadot found support at $14.66, following strong volatility. After witnessing an 8.86% surge within seven hours, DOT’s value began to crumble and consolidated between $15.15 and $15.46. The price soon broke down from this range and received support at $14.66. Since DOT was trading at $14.83, the market seemed to be seeing a host of indecisive traders.
After the latest breakdown, selling pressure overtook the market and the Stochastic RSI dropped under the Signal line. This fall pushed the asset into the oversold zone. However, as DOT found stability at the support level, the RSI line was about to cross over the Signal line, underlining the rise of buying pressure at the press time price.
Nevertheless, the Awesome Oscillator remained in the negative territory and suggested that DOT was still not out of the woods.
Ethereum Classic [ETC]

Source: ETCUSD on TradingView
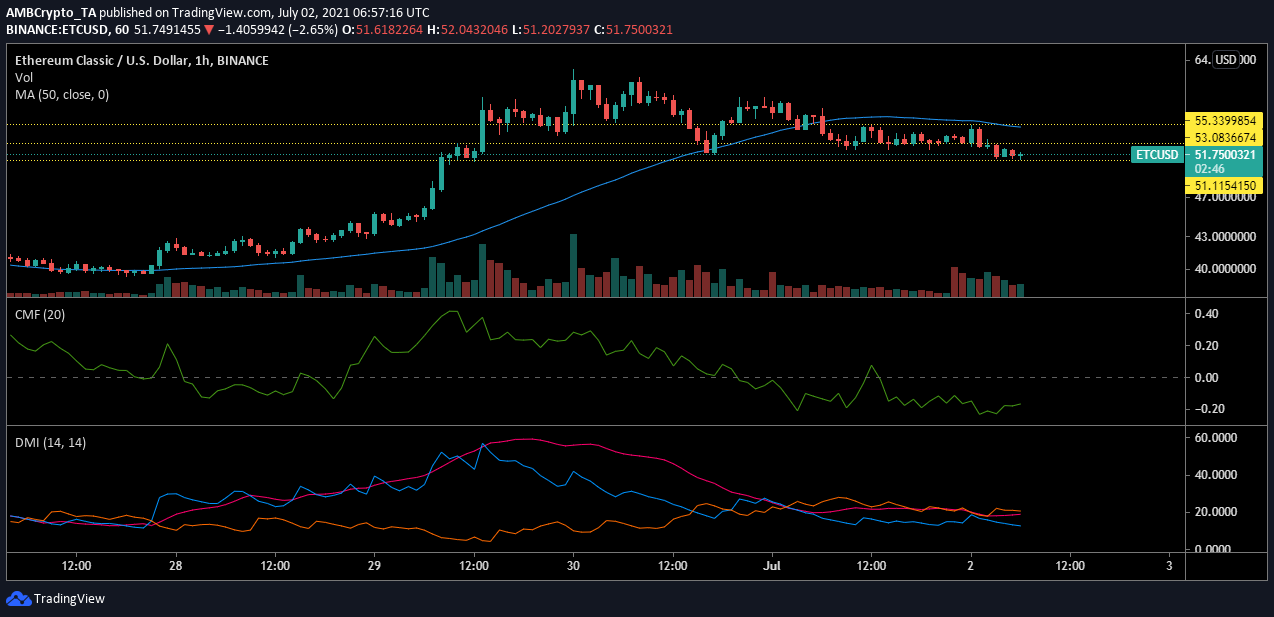
Ethereum Classic’s price was noting wild movements, which gradually dropped. After falling under the support at $55.33, the 50 Moving Average moved above the candlesticks, with the price suggestive of strong downward pressure. This kept the coin between $53.08 and $55.33 for a while before another sell-off pushed it to $51.11.
As the traders realized profits at the press time level, the ETC market turned bearish. Given the high sell-offs, money was leaving the ETC market and this was highlighted by the Chaikin Money Flow that dropped to -0.22. Further, the Directional Movement Index was also hinting at a dominant downwards pressure as the -DI remained above the +DI.
SUSHI

Source: SUSHIUSD on TradingView
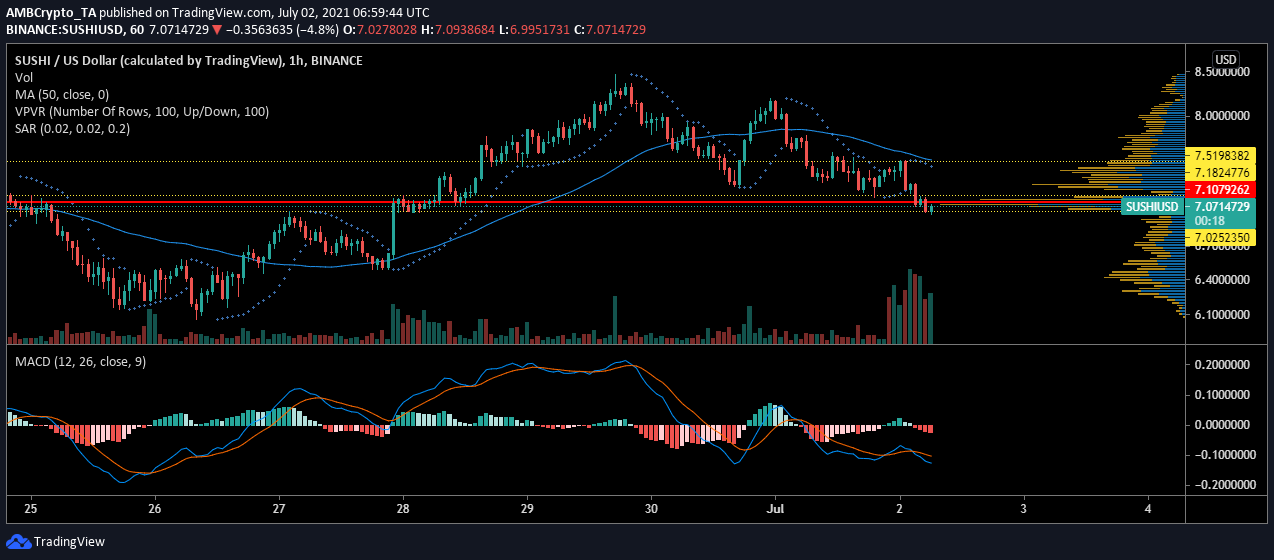
The SushiSwap market showed big movement for the asset over the past couple of days. This also invoked bearishness in the market. SUSHI’s price spiked by almost 13% within 6 hours on 1 July, after which it toppled down by 14%. The asset was trading at $7.12 at press time as it remained close to the support at $7.02.
Traders seemed to be highly interactive at the said price level. This maintained the price between $7.02 and $7.18. The Visible Range noted that the Point of Control was at $7.10, which was a price level that SUSHI was highly traded at over this time period. The MACD indicator highlighted that the bears were taking the lead.
Even the Parabolic SAR’s markers were aligned above the candlesticks and underlined the rise of bearishness in the market.


