Polkadot, Ethereum Classic, Tron Price Analysis: 03 June

After the dip in the cumulative crypto-market cap on 29 May, the sector has seen a steady recovery. In fact, the market has seen its market cap hike by almost 18% since. While Polkadot’s price saw a larger range recently, other alts like Ethereum Classic and Tron fluctuated between their restricted ranges.
Polkadot (DOT)

Source: DOT/USDT on TradingView
Master Ventures was in the news after it launched a $30 million fund for crypto-projects aiming for a parachain slot on Polkadot. In less than a year, DOT has finalized blocks with 3.75 million transactions and 344,198 active accounts.
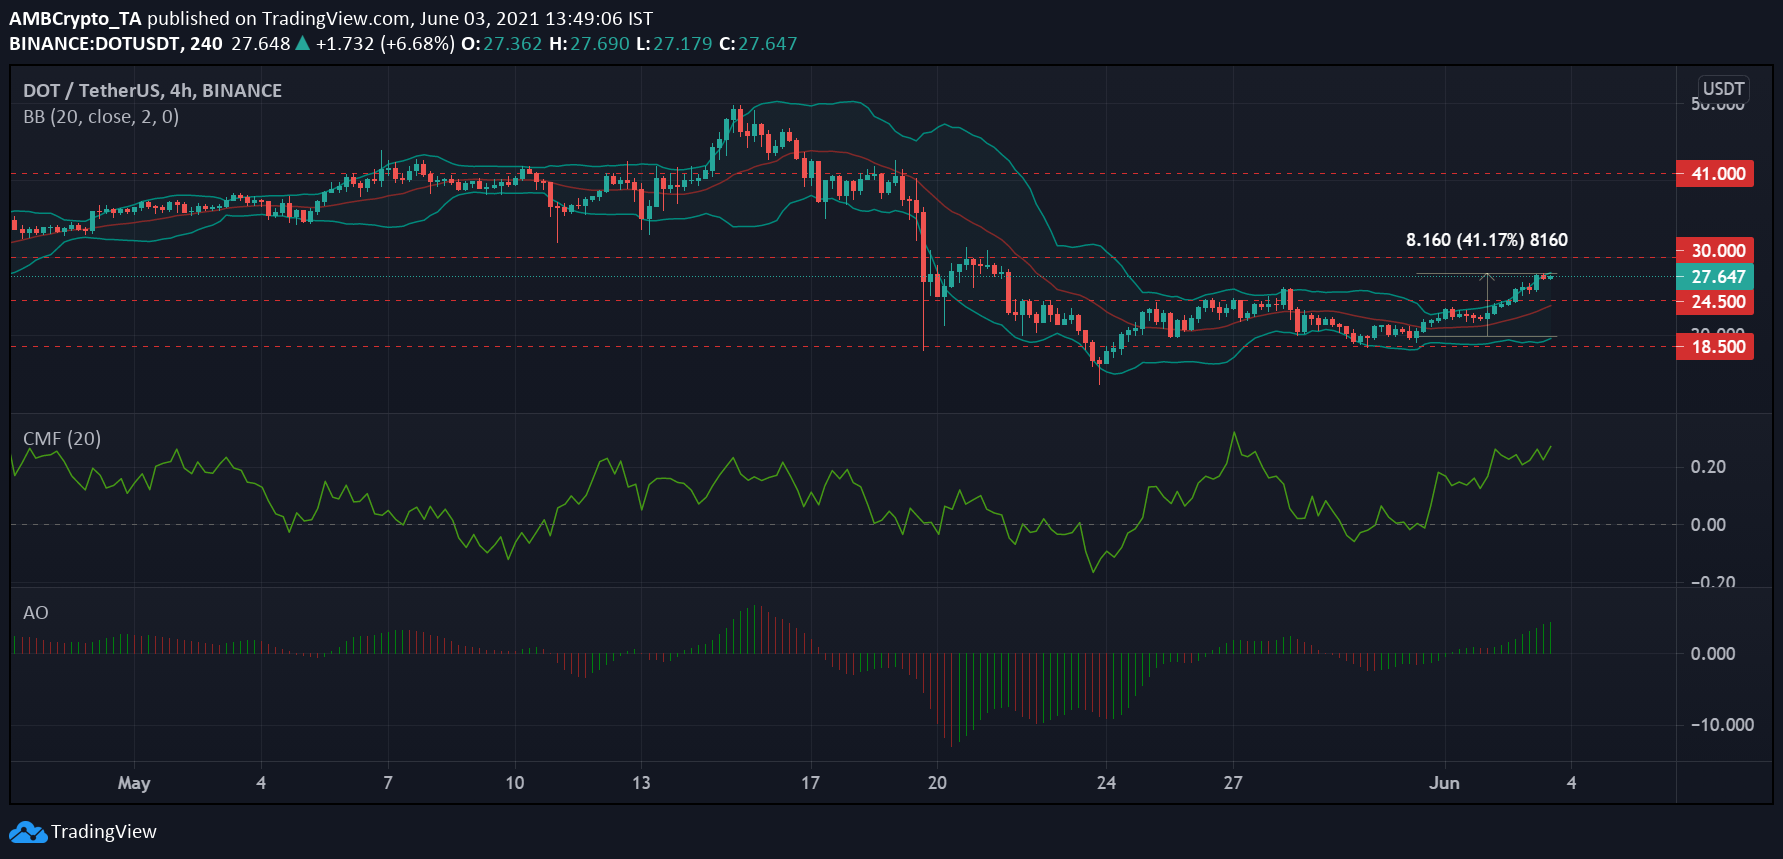
At press time, DOT was trading around the $27.80-level and its RoI over the past 7 days v. USD was up by 15.56%. The crypto-asset saw an 18.7% 7-day price hike and was ranked eighth on CoinMarketCap, at press time.
Bollinger bands for DOT opened on June 2 and depicted a continued divergence at press time, something that pointed to increased volatility and higher potential for market movement. After testing the $24.5 resistance mark on June 2, DOT’s price has been moving up. The next major resistance level lay at the $30 mark which can be breached if the price continues its upward trend.
The price rise corresponded with the Awesome oscillator as after some bearishness, the trend crept to become a more dominant bullish one. Further, the Chaikin Money Flow showed that the capital inflows were high which pushed the price up, keeping the trend bullish.
Ethereum Classic (ETC)

Source: ETC/USD on TradingView
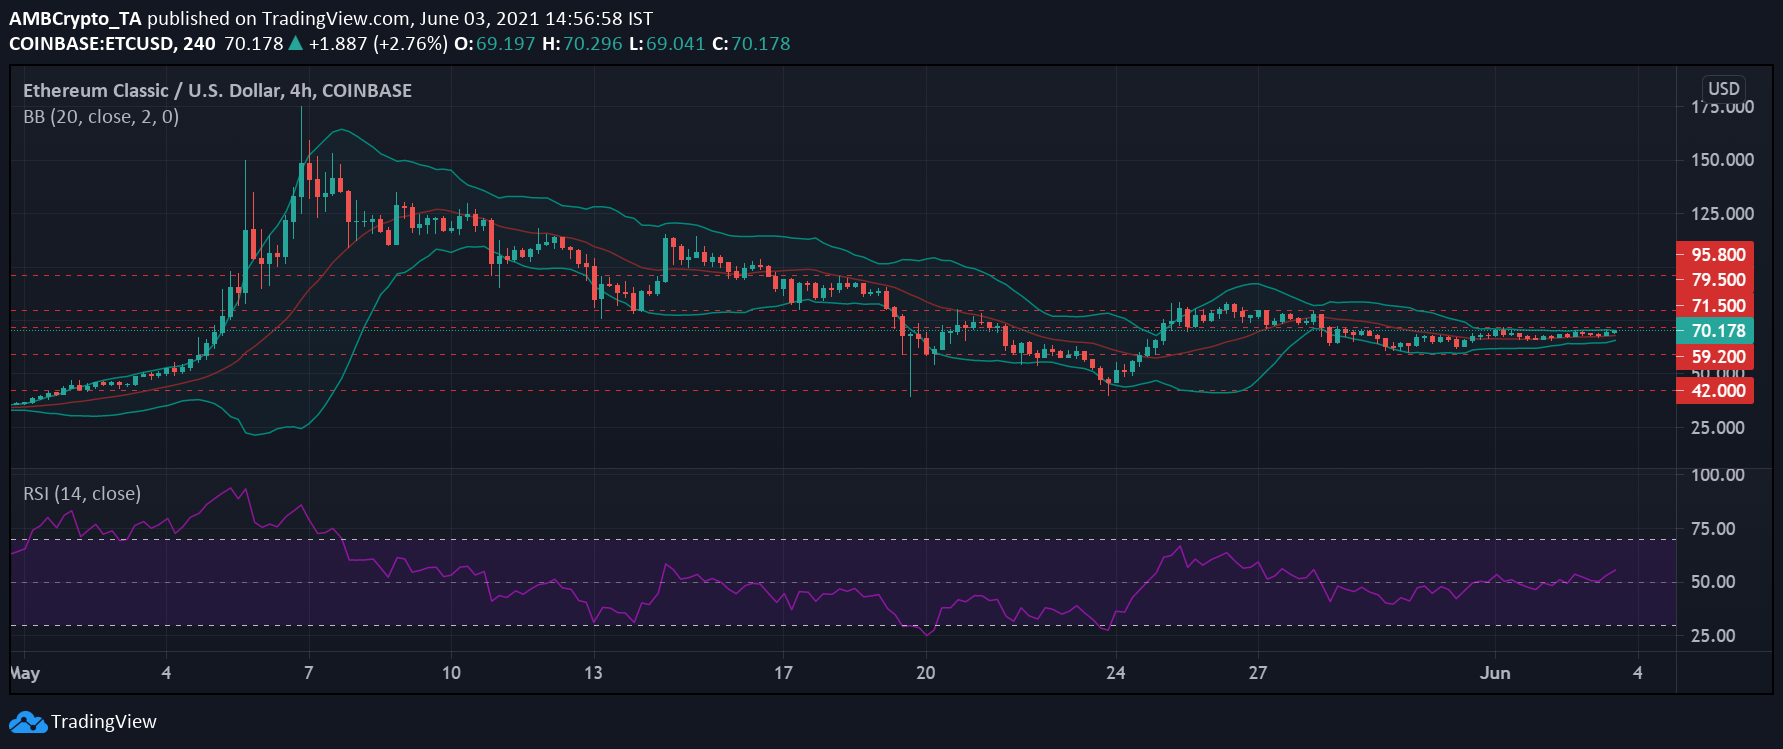
Ethereum Classic was trading at $70 at press time, with the crypto down by 8.8% in the last 7 days and ranked 21st on CoinMarketCap. The asset’s ROI over the past 7 days, vs USD, was down by almost 6.5% and its price showed restricted movement between the $59.2 support and $71.5 resistance levels.
On the 4-hour chart, short-bodied candlesticks represented a period of consolidation for the asset. The Bollinger Bands remained closely constricted as volatility was low. Thus, there were no huge price swings over the last week. However, a breakout above the $71.5 resistance mark could see a price rise to the $79.5 resistance level.
Furthermore, the Relative strength index (RSI) also maintained neutral territory and moved between 40-60. The indicator showed a slight rise in buying pressure taking it above the 50-mark, at press time.
Tron (TRX)

Source: TRX/USDT on TradingView
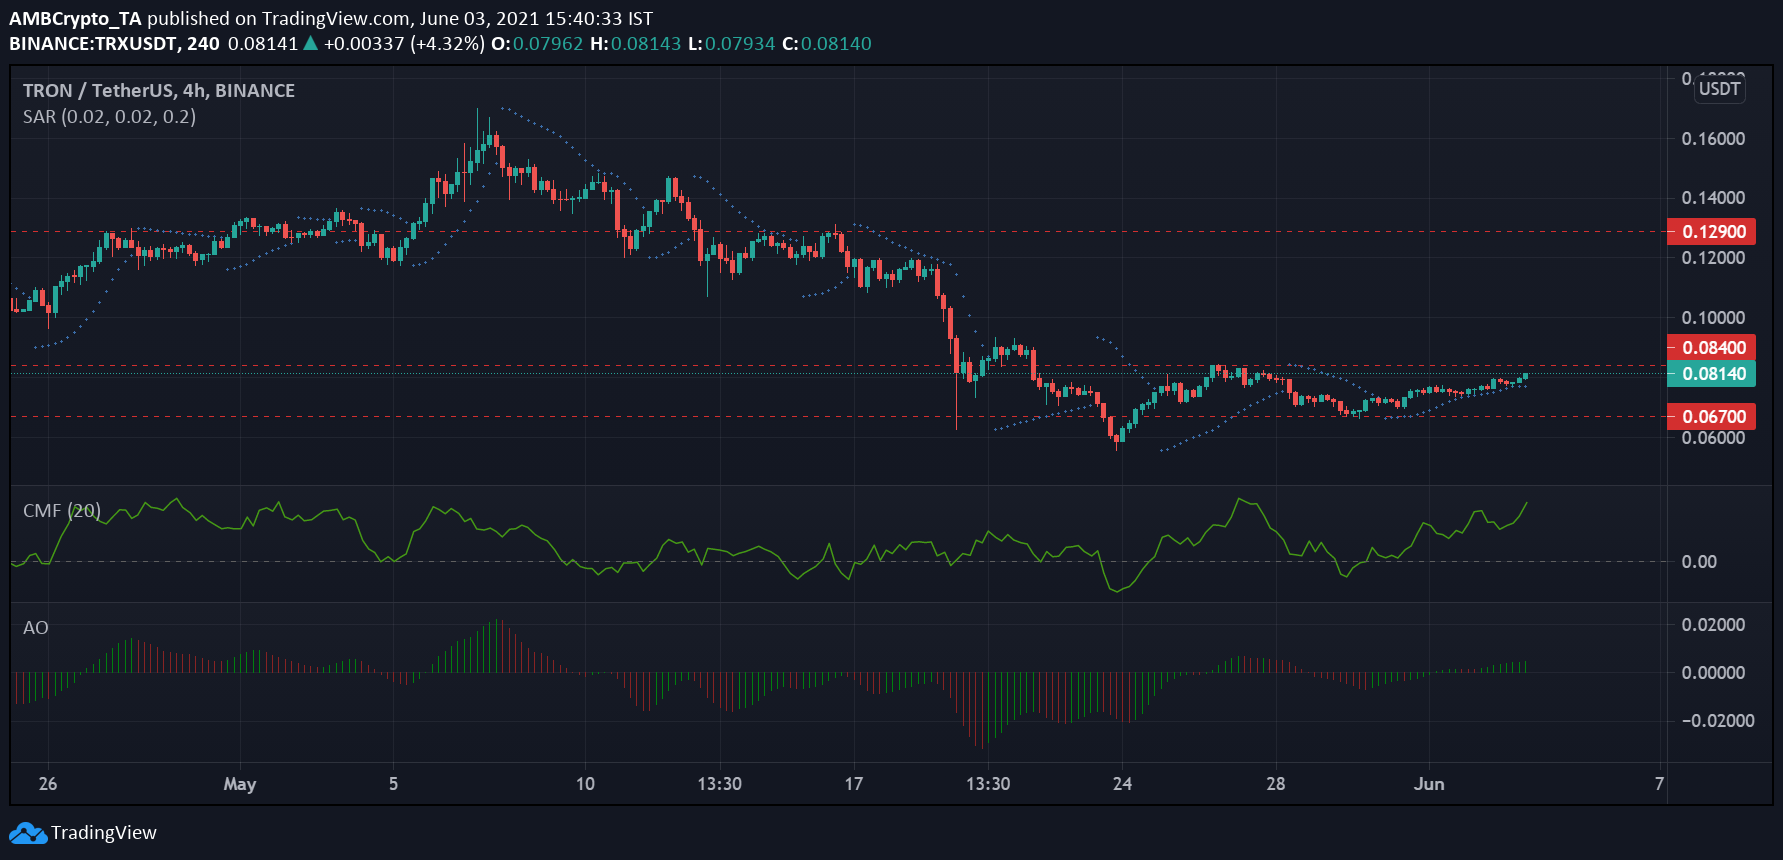
Tron was trading at $0.0811 at press time and was ranked 24 on CoinMarketCap’s rankings. TRX saw a 35% price dip from May 20 and its recent price movement suggested a slow recovery from the same.
TRX’s price has been fluctuating between the $0.067 support and 0.084 resistance levels since May 24. If its price crosses the $0.084 resistance level, it could see a hike to the next major resistance level at $0.129. The Parabolic SAR’s dotted lines below the candlesticks highlighted slight bullish momentum.
Additionally, the Chaikin money flow highlighted that capital inflows were predominant and could push the price up, keeping the trend slightly bullish. Similarly, the asset’s moderately bullish trend was supported by the Awesome Oscillator’s bullish movement. The indicator crept into a dominant bullish trend on June 1.


