Polkadot, Litecoin, MANA Price Analysis: 10 December

Most altcoins tried to recover as the bears extended their trend and capitalized on the broader sentiment.
Altcoins like Polkadot and Litecoin formed a bearish flag while MANA recovered from a bearish pennant over the past day. The near-term technicals for these cryptos undeniably preferred the bears.
Polkadot (DOT)
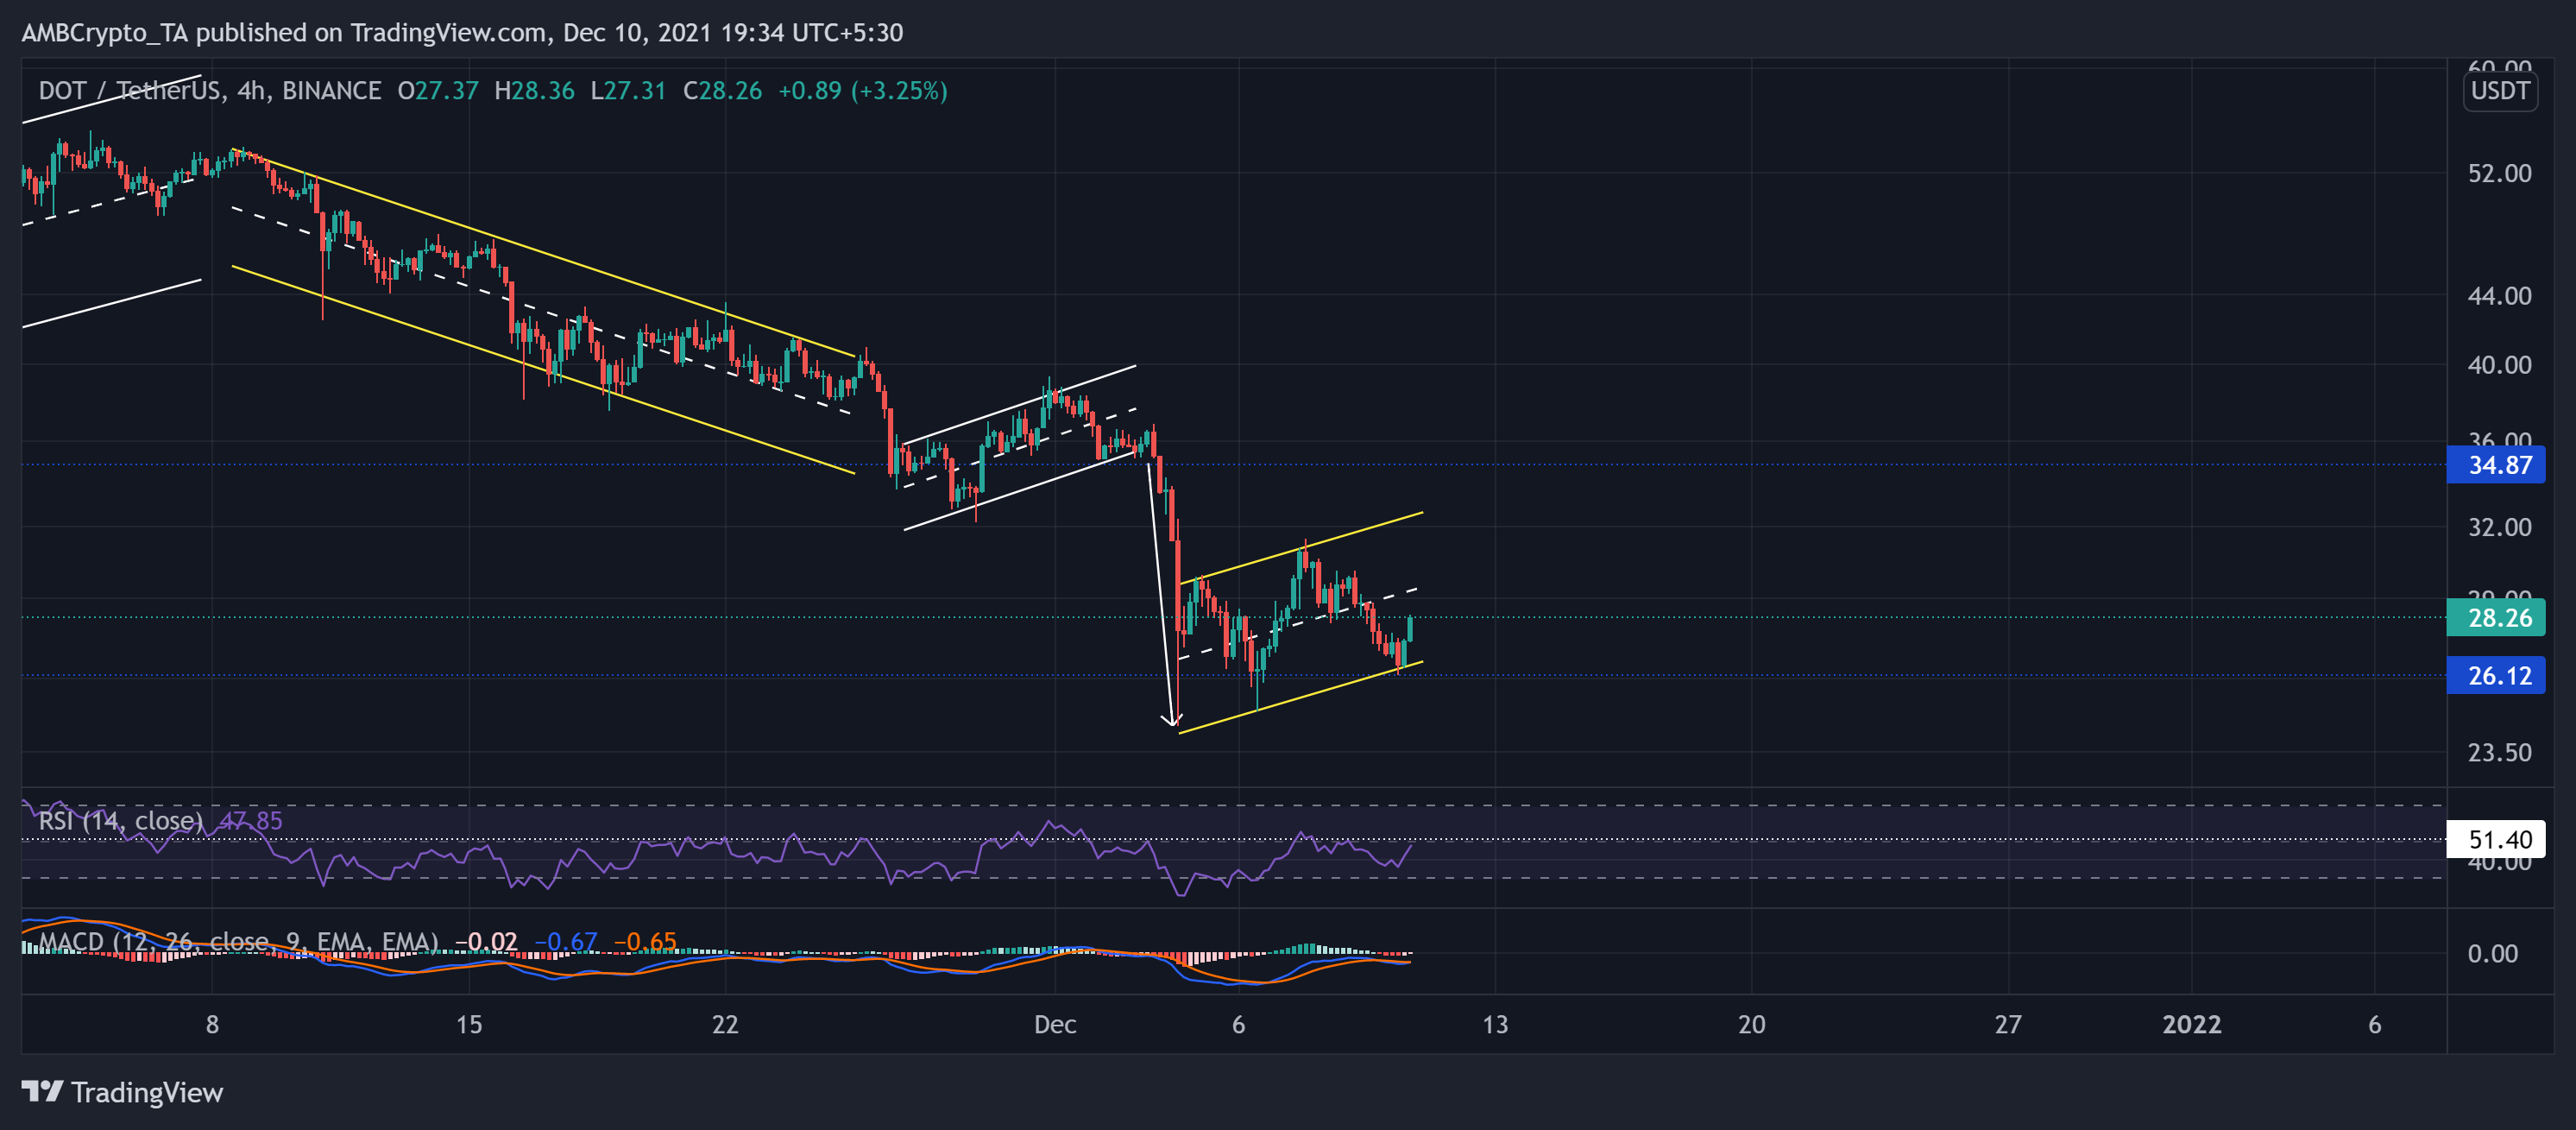
DOT has rather aggressively declined after striking its ATH on 4 November. After a 17 day downfall in a descending channel, it saw a slight recovery attempt but gravitated toward the $24-mark on 3 December.
Due to the recent movements, DOT formed a bearish flag on its 4-hour chart. In the past six days, the alt nudged the 14-week support level (at the $26.1-mark) thrice. This indicated that the bulls did not fully dwindle and had a decent recovery potential in the near term.
At press time, the alt traded at $28.26. DOT found a strong RSI resistance near the half-line for over a month. This reading discouraged strong near-term recovery chances. Further, the MACD affirmed the previous narrative by choosing the sellers.
Litecoin (LTC)
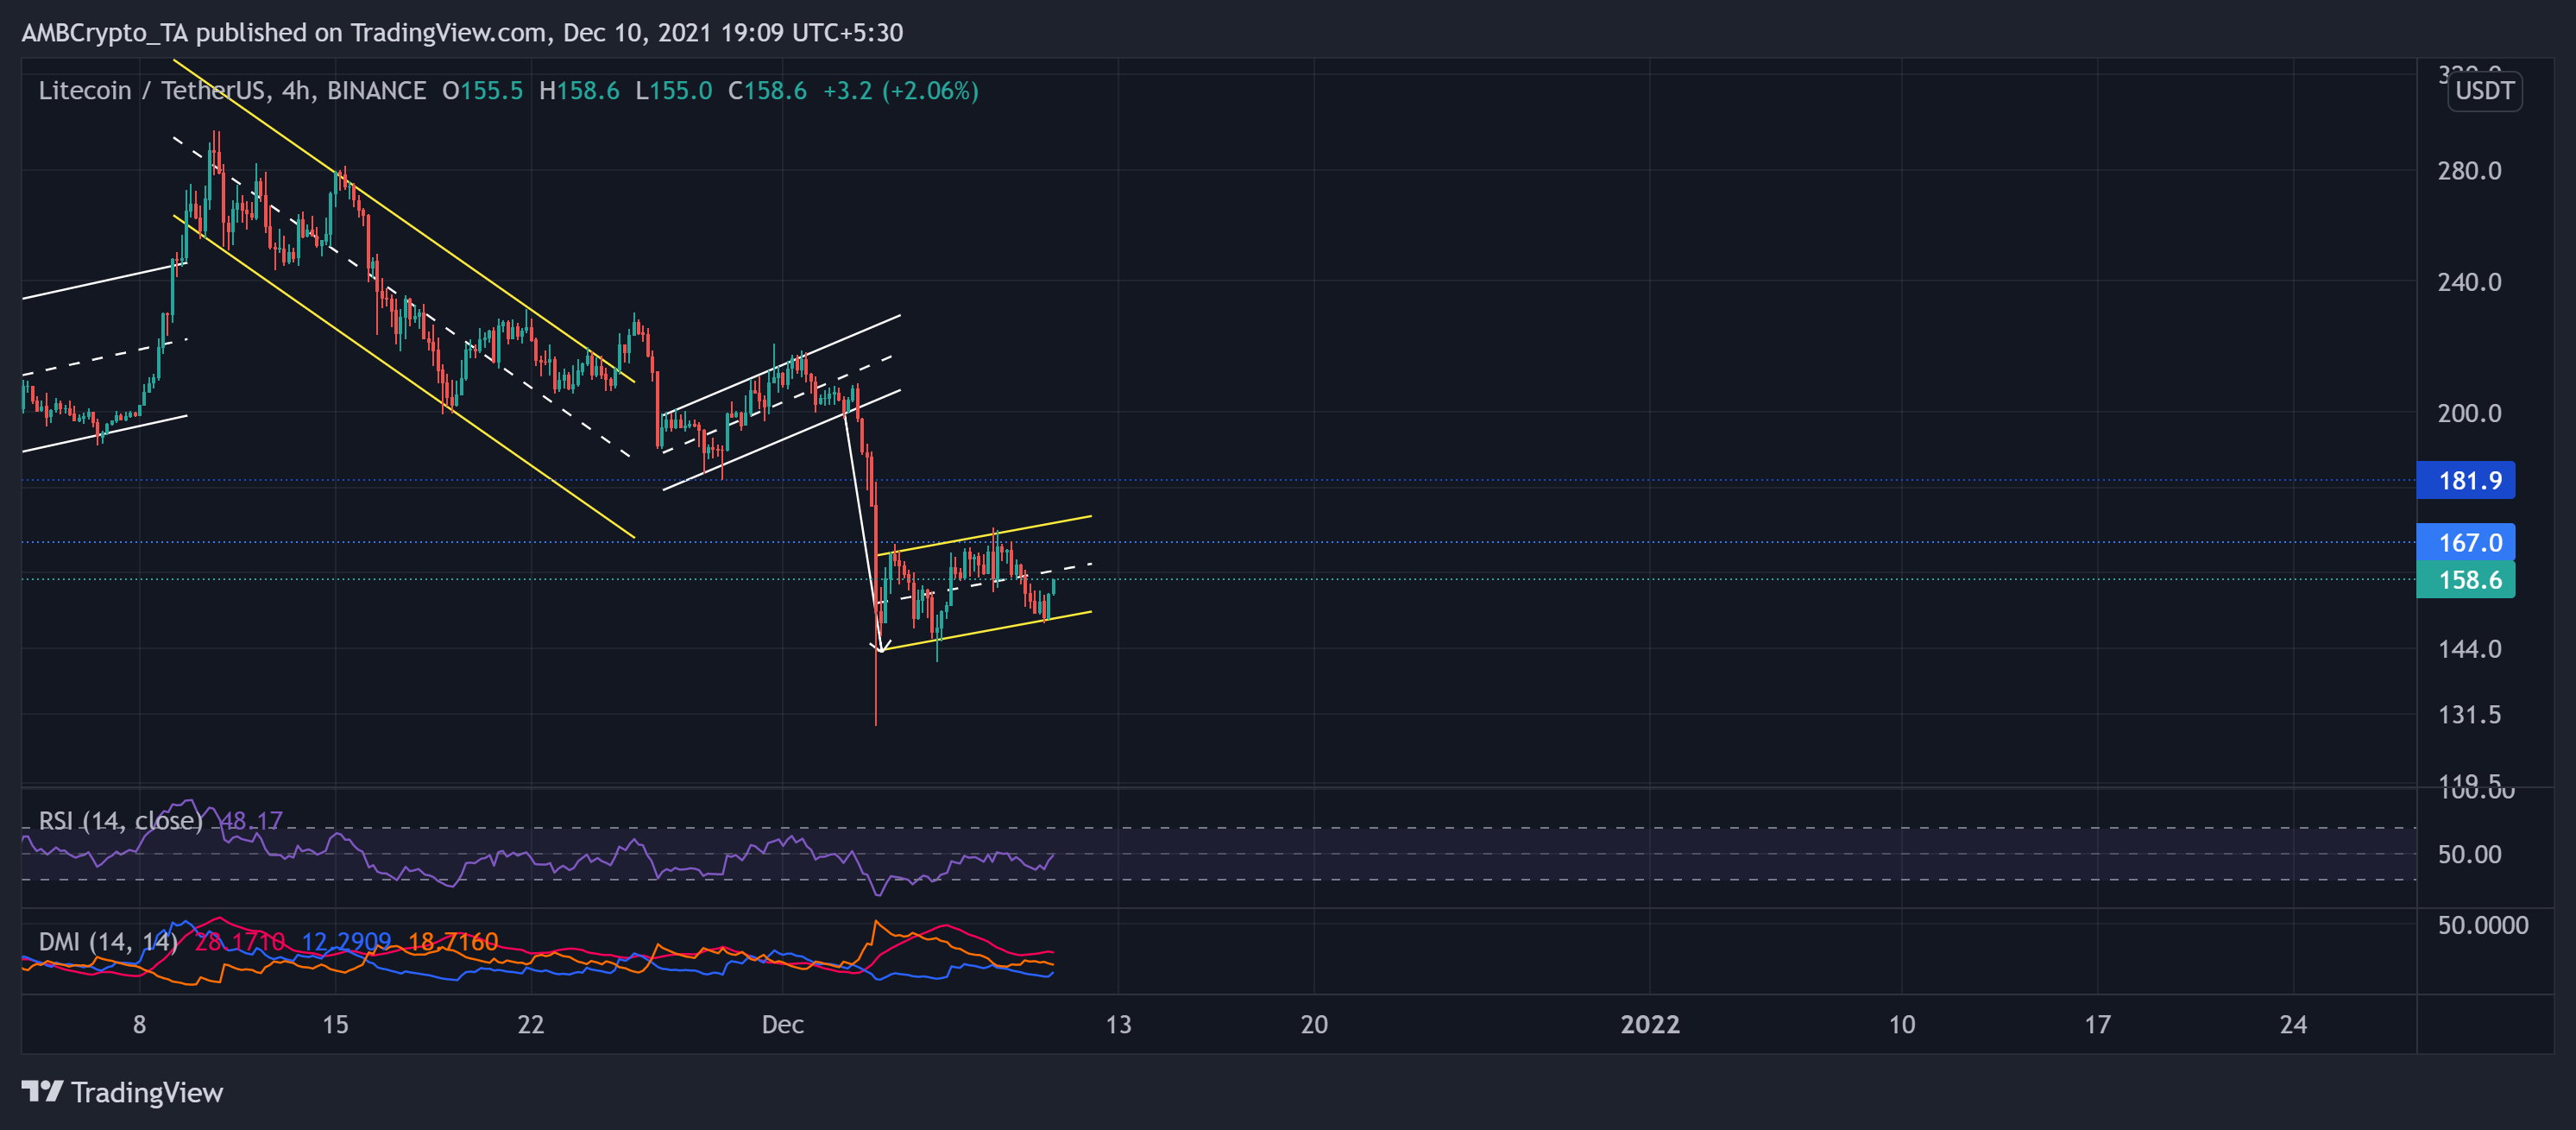
The altcoin depicted a high correlation with the large-cap cryptos. Thus, it consistently fell in a descending channel after touching its 25-week milestone on 10 November. As a result, the alt registered an over 41% 30-day decline.
As witnessed on the 4-hour chart, LTC formed a bearish flag over the last week. After poking its 18-week low on 3 December, it retested the $167 resistance twice over the past six days. At press time, LTC traded at $158.6.
The RSI has been testing the equilibrium since 2 December but still could not breach it, visibly depicting a bearish influence. Further, the DMI also skewed in favor of the sellers but hinted at slim chances of a near-term bullish comeback.
Decentraland (MANA)
MANA truly witnessed a dynamic trajectory since late October. During the bright phase for the Metaverse tokens, MANA rallied to its ATH. Then, after a descending wedge breakout, the price action transposed into an ascending channel.
However, since then, the bears retested the $4.9-mark resistance thrice before a significant slump. The downturn finally correlated with the market trend, unlike its previous rallies. Now, the alt saw an expected bearish pennant breakout over the last day. Consequently, at press time, the alt traded at $3.577 after noting a 5.6% 24-hour loss.
The RSI showed a decent recovery but needed to cross its midline resistance to flash a bullish bias. Also, the DMI slightly favored the bears but depicted a weak directional trend.


