Polkadot, NEM, Neo Price Analysis: 22 January

Polkadot traded within a range of $15 and $18.25 over the past few days and noted short-term bullishness, one that could see it test the $18-level once more. NEM and Neo held on to levels of support in the face of bearish sentiment, but they would drop below in the coming days unless buyers step in to absorb the selling.
Polkadot [DOT]
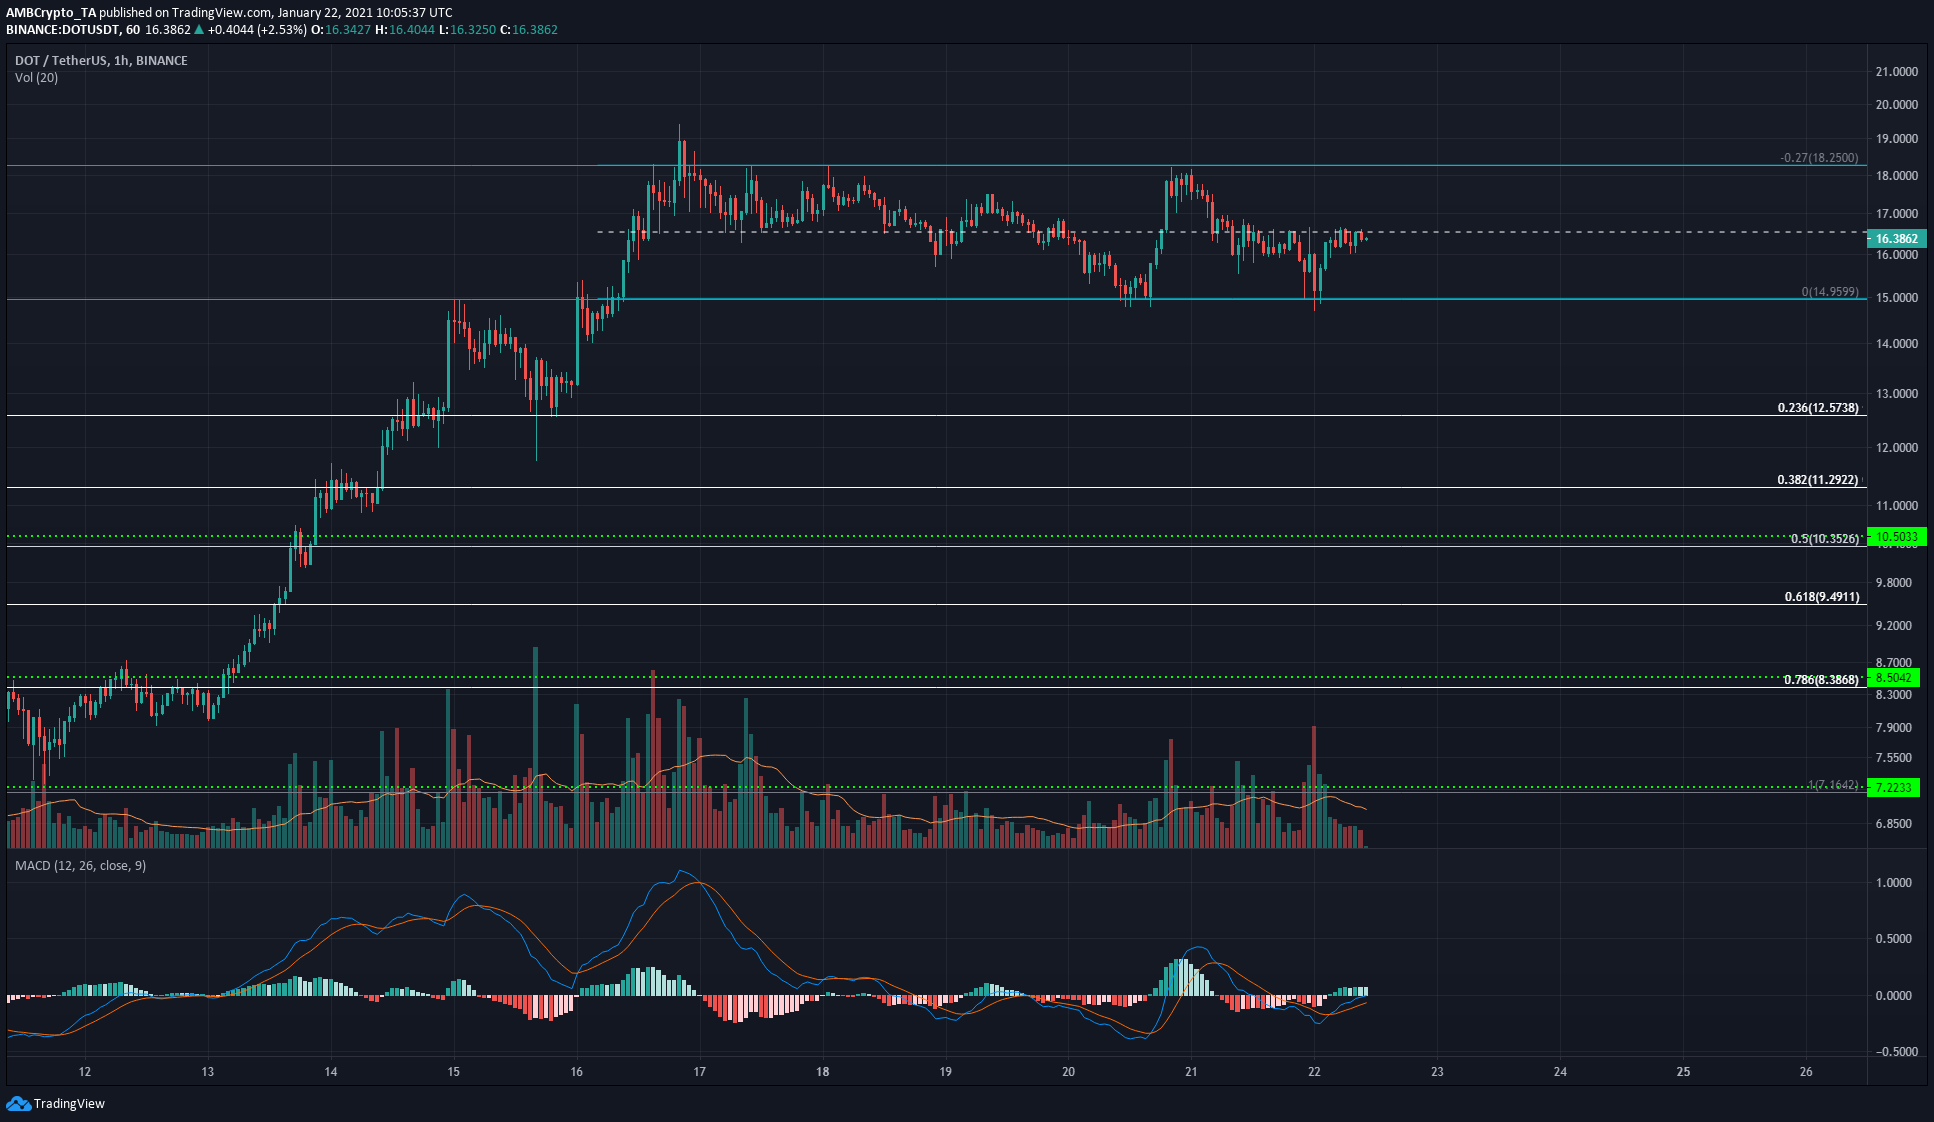
Analyzing the 1-hour chart for DOT, it can be seen that DOT was trading within the range of $14.95 to $18.25 – the local top as of mid-January, and its 27% extension level.
At the time of writing, DOT was trading just beneath the mid-point of the range at $16.53. A rejection at the mid-point would see DOT descend back towards $14.95. Climbing past the mid-point will see DOT push towards the range highs once more. The mid-point is the most significant level within a range, and whichever side claims this level as their own will be dominant in the market.
The MACD noted weak bullish momentum behind DOT.
NEM [XEM]
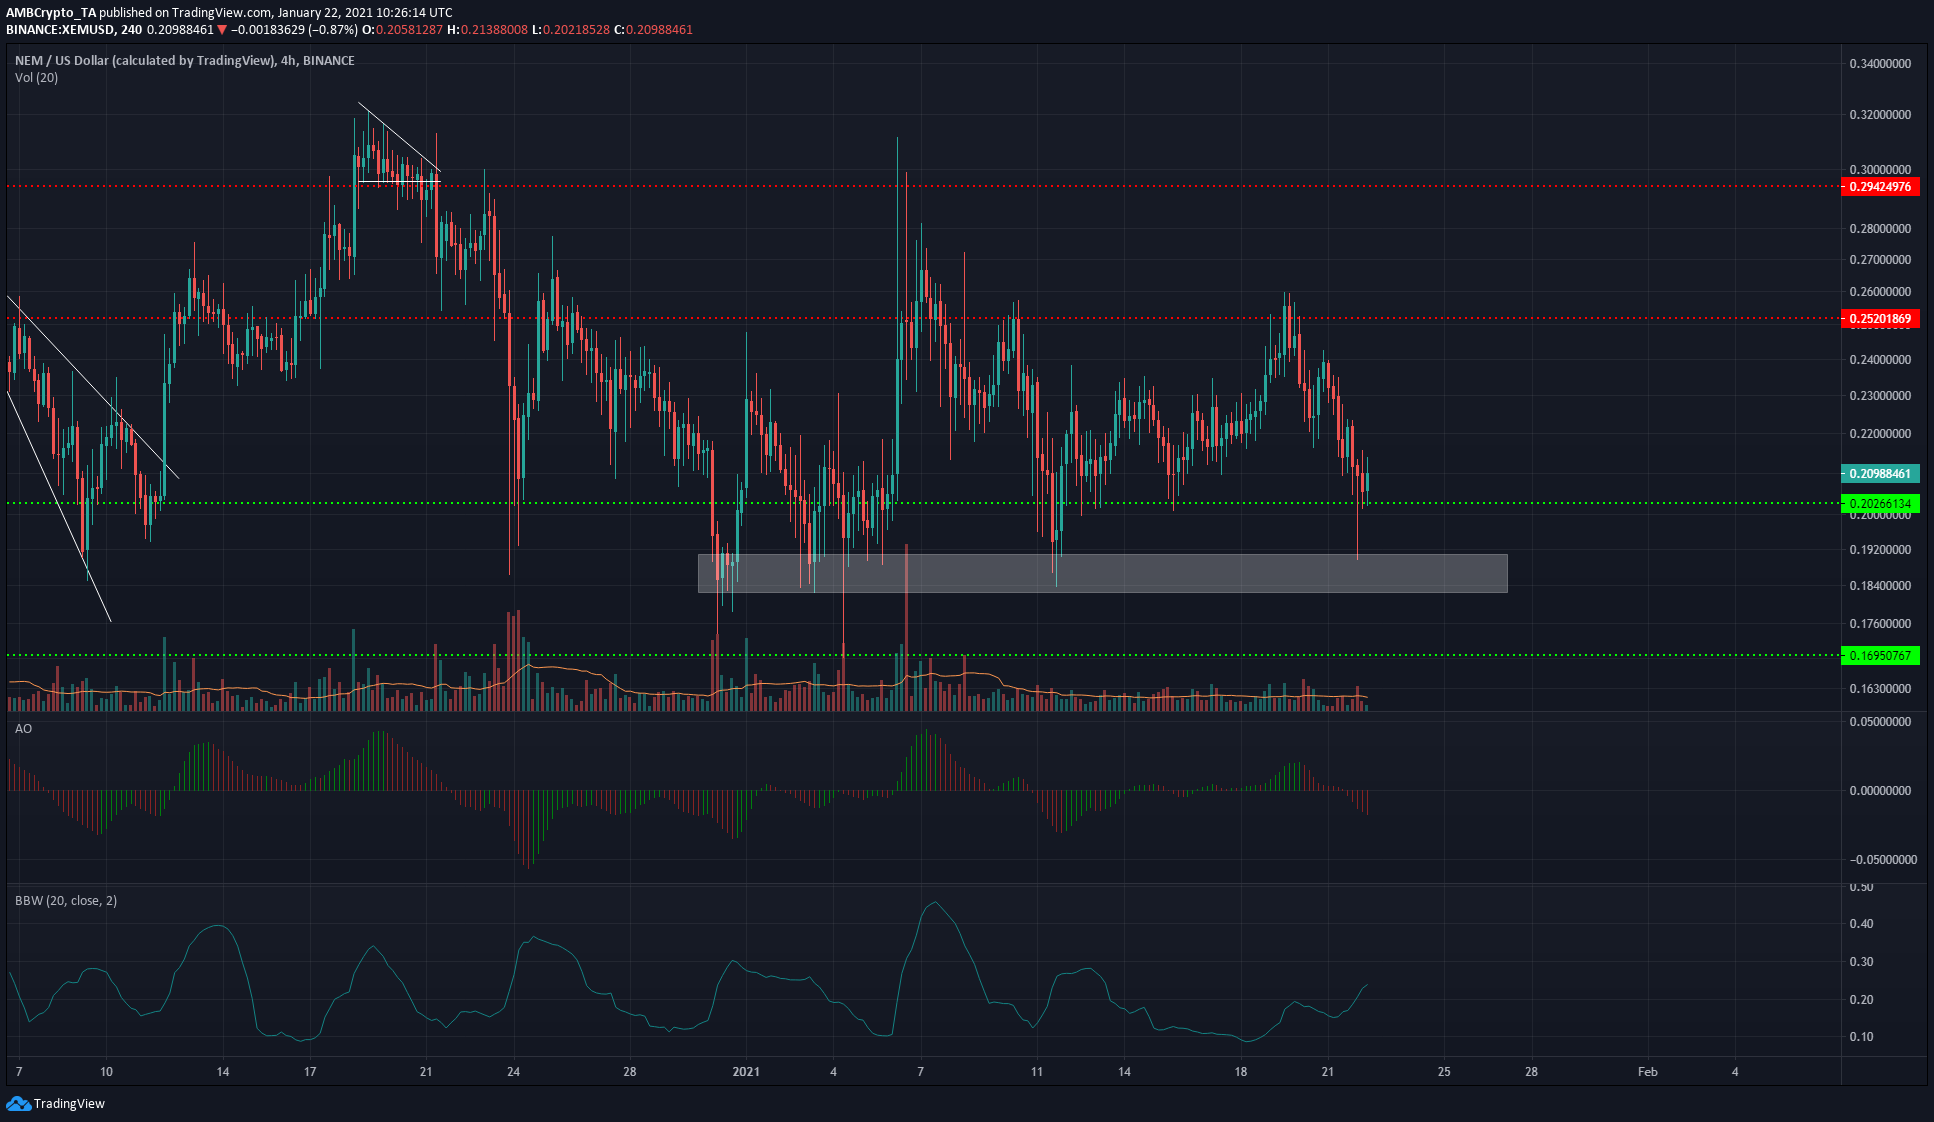
The Bollinger Bands Width indicator was rising to highlight the heightened volatility XEM was experiencing lately.
XEM has been unable to rise above the $0.25-level – forming a double top there and being forced all the way down to test the support at $0.2. And it could be headed further south.
The Awesome Oscillator noted bearish momentum for XEM and the $0.182-$0.192 region of demand could be tested over the next few days.
Neo [NEO]
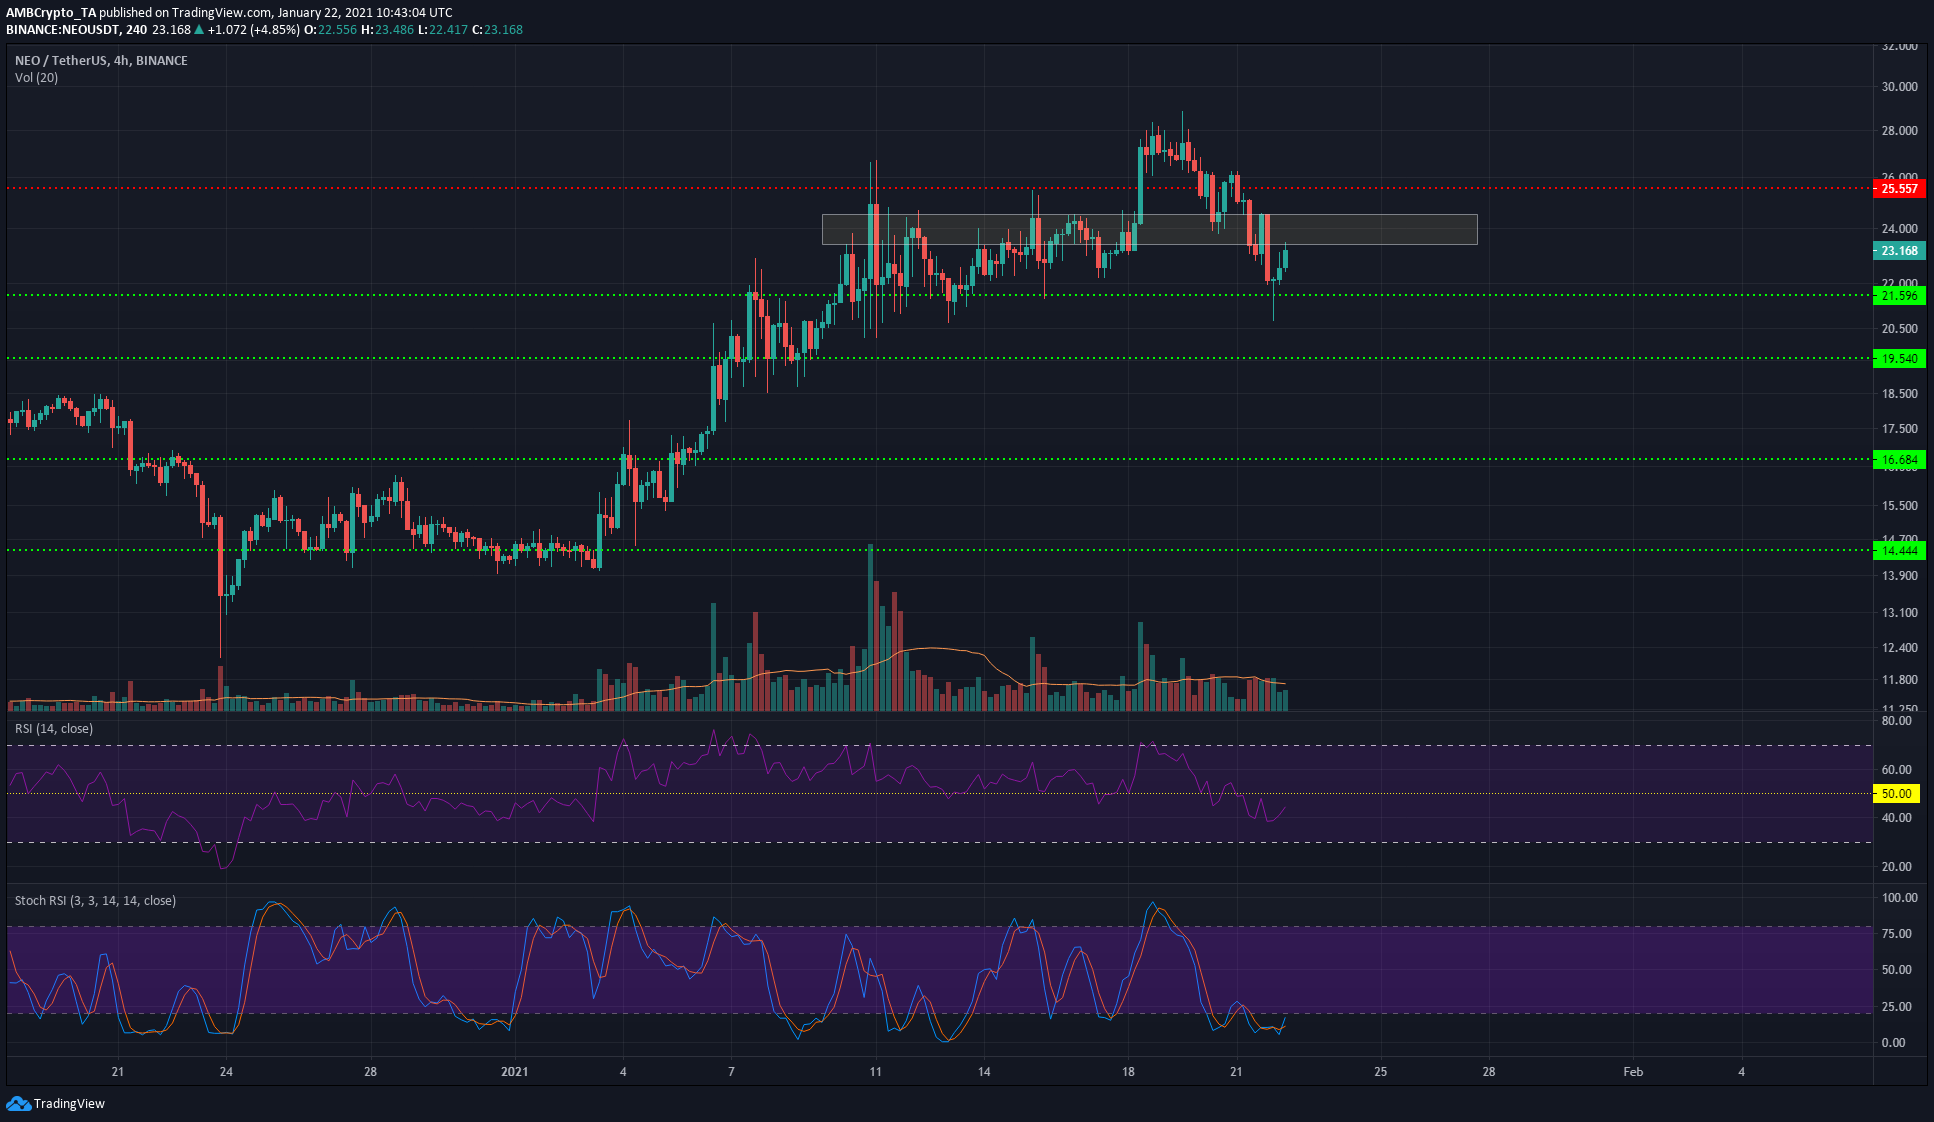
The $23.4-$24.5 region was a region of supply for NEO earlier this month. The market’s bulls flipped this region to one of demand, but not for long.
NEO slid once more beneath this region and at the time of writing, it was attempting to climb past it. The Stochastic RSI was oversold and heading higher, suggesting that some upside was possible for NEO. And yet, the RSI was under 50, indicating strong downwards momentum.
Rejection at this region of supply would see NEO test $21.6 as support once more.