
The world’s largest cryptocurrency Bitcoin climbed on the charts and headed towards the $29,000 mark and the broader altcoin market followed suit and registered a surge in price. Polkadot was one such example, climbing nearly 12% in the past 24 hours. On the other hand, altcoins VeChain and NEM struggled to maintain positive returns and moved in the opposite direction.
Polkadot [DOT]
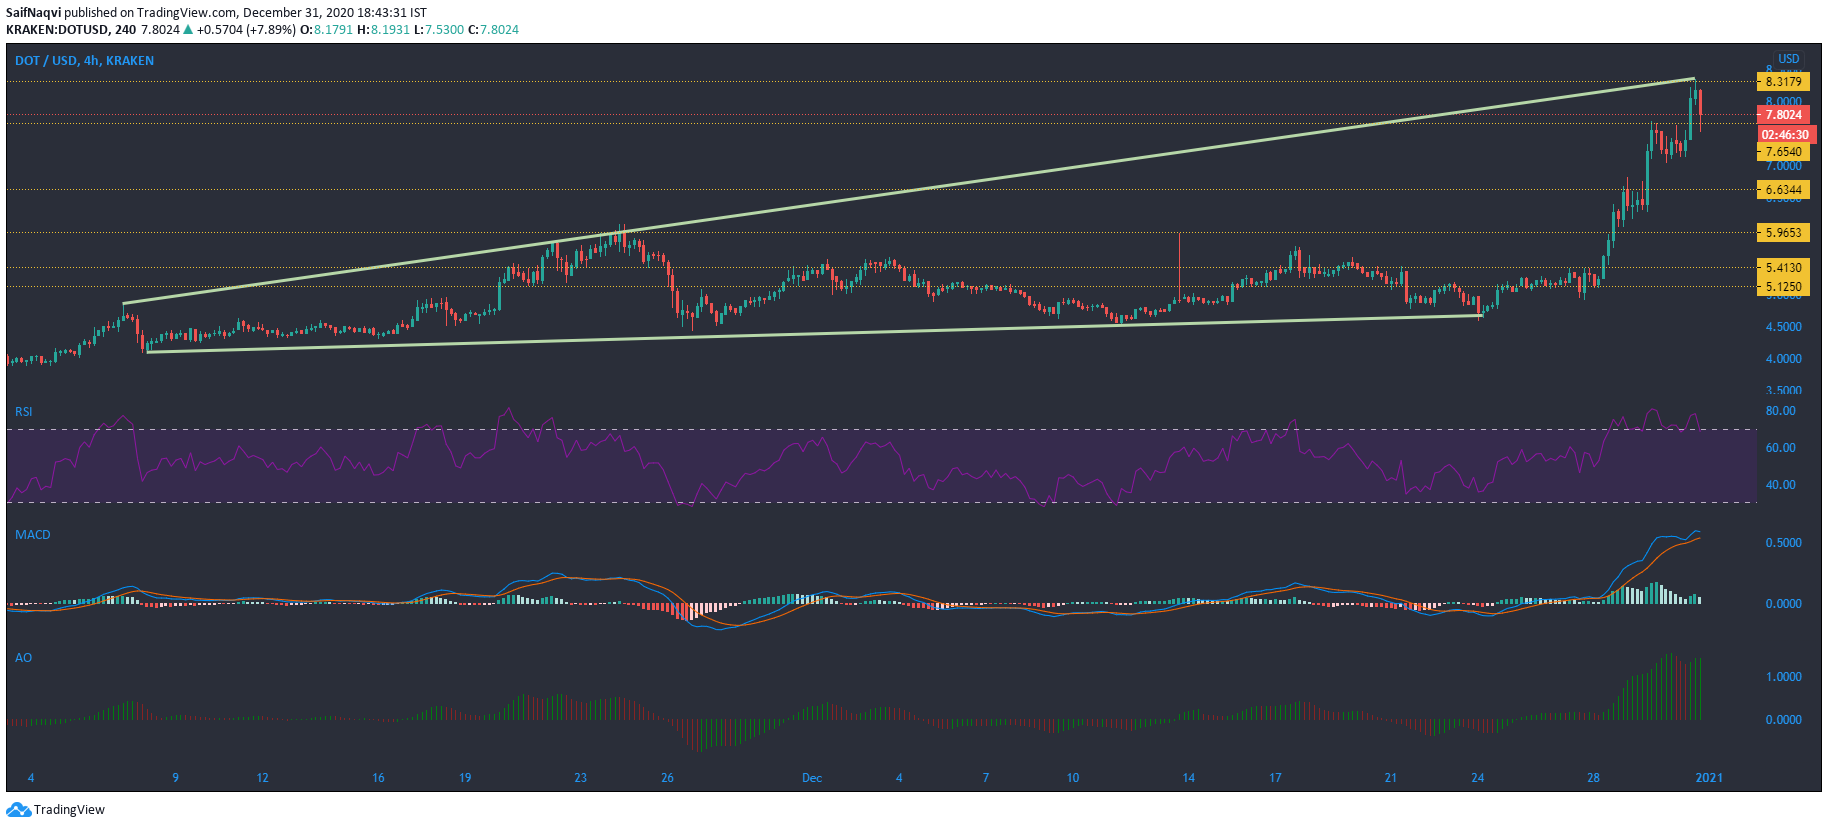
Source: DOT/USD, TradingView
While Polkadot has had a shaky start to the month, prices have spiked along with the market leader Bitcoin during the past three days. Overall, the crypto asset has been in an uptrend since early November, hitting higher highs and higher lows. Currently, DOT is leading the charts as the biggest gainer in the past seven days, rising by nearly 70% in this period. The biggest question is – will we see a correction anytime soon? The indicators on DOT suggest otherwise, hinting that prices could continue to scale past milestones in the near future.
The Relative Strength Index indicated bullishness as prices have been trading in the overbought zone for quite some time now. Usually, prices move downwards after trading in this region, but in this case, they could remain in this territory over the next few sessions as the buying pressure mounts up. If a reversal takes place and the index moves lower, prices could test support at $7.65.
The Awesome Oscillator also highlighted the said bullishness, as the green bars were rising in length, above the Zero line.
VeChain [VET]
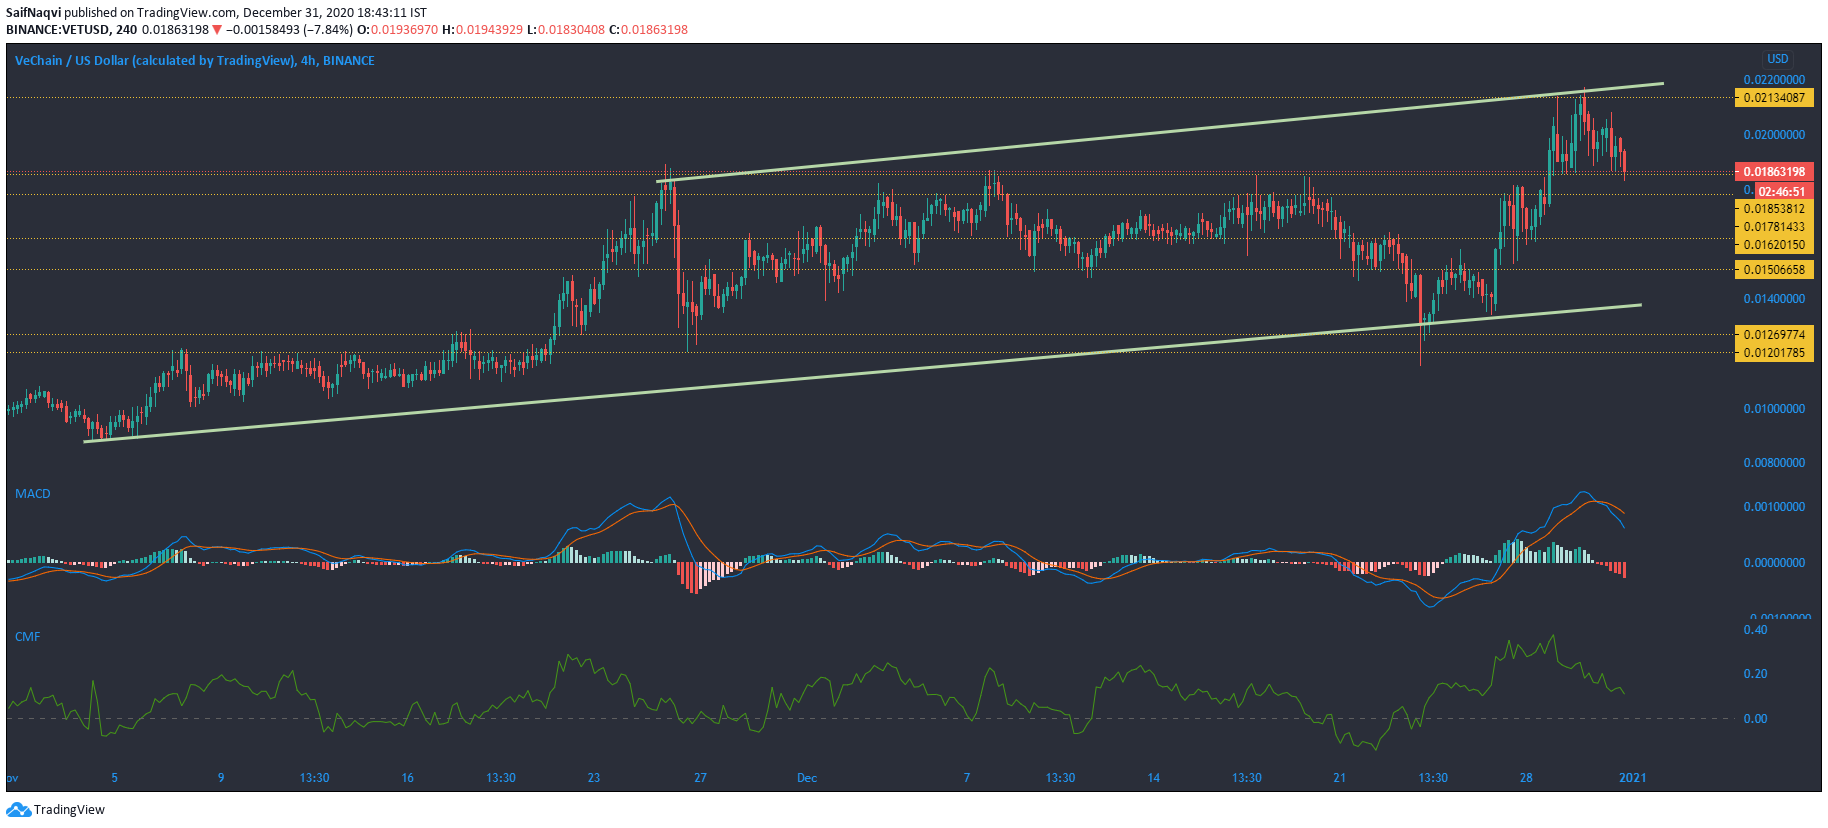
Source: VET/USD, TradingView
Like Polkadot, VeChain has also been in an uptrend since early November. However, the price seemed to have cooled off since meeting resistance at $0.02. At the time of writing, VET was trading at $0.018, down by over 3% in the past 24 hours. Certain indicators suggest that selling pressure could continue to drive prices lower in the short term.
The MACD witnessed a bearish crossover, a sign that prices could fall in the coming future as the bears assert their dominance in the market. In case VET does fall, support at $0.0138 could provide some relief to prices.
The Chaikin Money Flow suggested that capital outflows were one of the factors responsible for the price drop, with the index moving downwards along with the prices.
NEM [XEM]
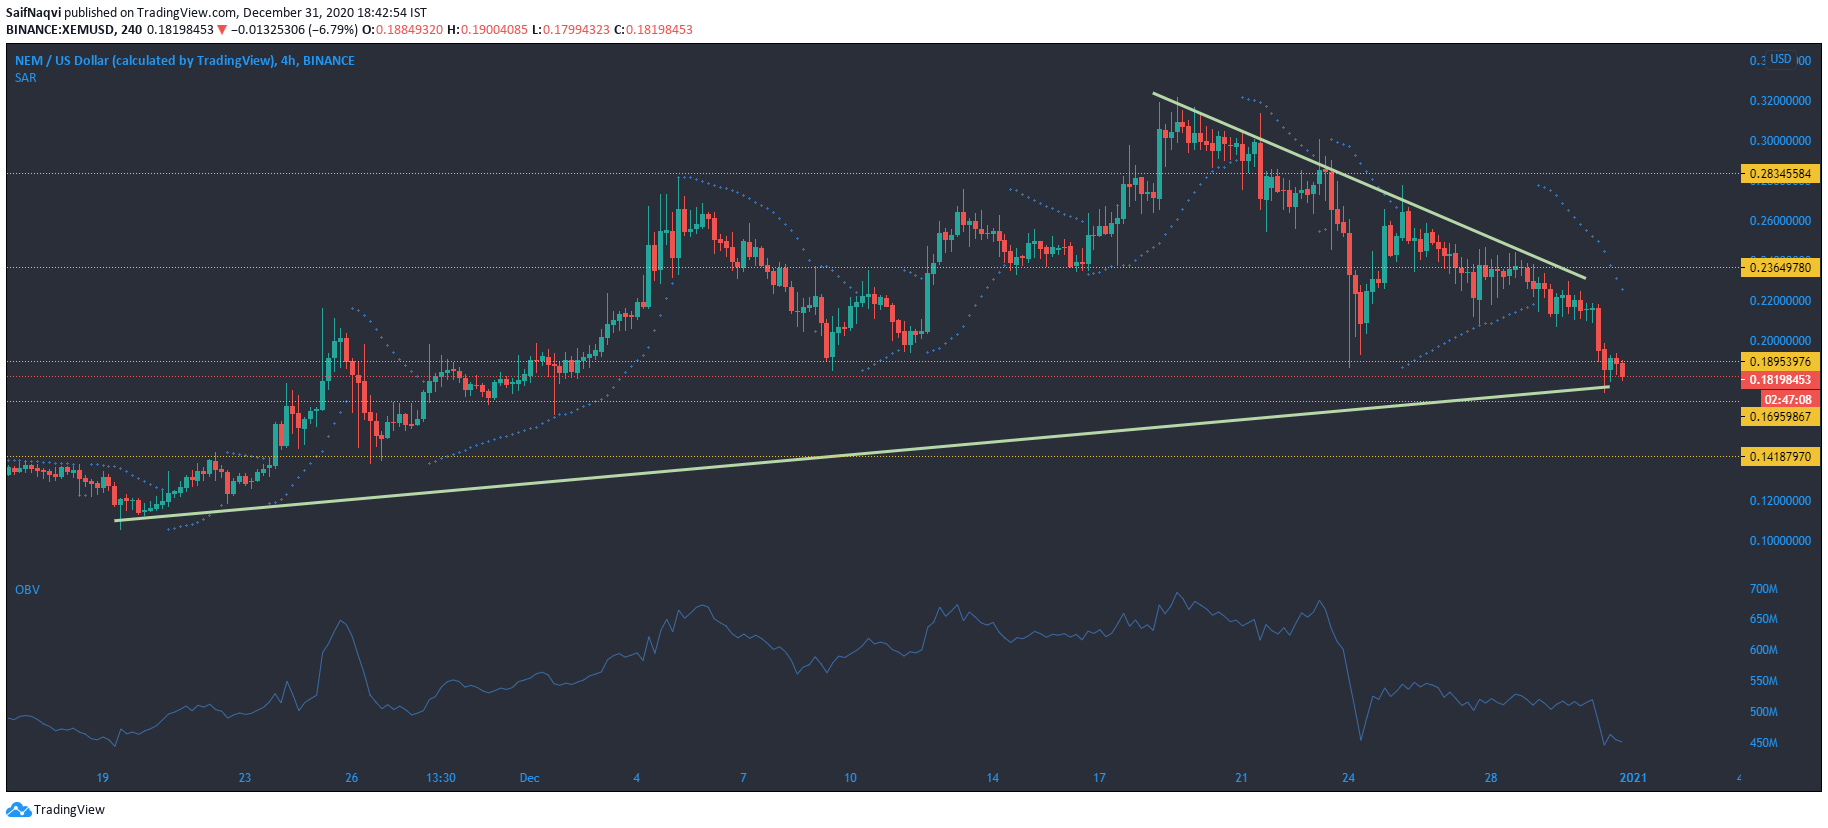
Source: XEM/USD, TradingView
NEM has been under severe selling pressure over the past 24 hours. During this time period, prices have dropped by nearly 15%, making NEM the biggest daily loser among the top 20 coins by market cap. After trying to breach resistance at $0.236, prices have steadily moved lower, towards the support at $0.169. In the near term, prices could continue moving lower and challenge support at $0.169. A sharper fall could see NEM head towards support at $0.141.
The On Balance Volume suggested that there has been a lack of interest in the NEM market as volumes dropped throughout mid-December.
The Parabolic SAR’s dotted markers were above the candlesticks, an indication that prices were bearish.