Polkadot Price Analysis: 08 June

Bitcoin suffered from another sell-off pushing its value to the $32,700 price level. Following BTC, Polkadot also shed over 5% of its value within an hour and could be heading lower.
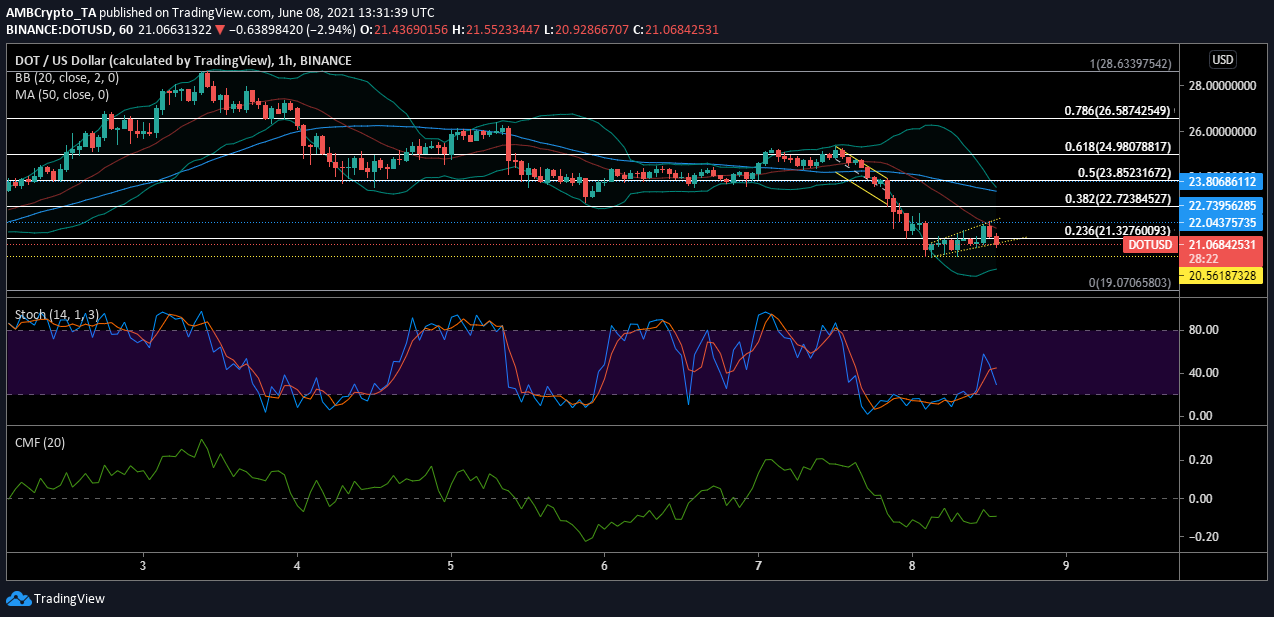
Polkadot hourly chart

Source: DOTUSD on TradingView
After dropping 18% from its value within 13 hours, DOT’s price dropped to $20.56. Retracement hit resistance at $22.04 and thus, began the current downtrend.
Reasoning
Volatility noted an uptick with the recent fall across the cryptocurrency market. With the market remaining volatile, traders were actively realizing their profits with some ‘buying the dip’. A similar tug of war was witnessed in DOT’s market as the price remained under the 23.60% Fibonacci retracement level.
While a majority of traders expected the price to fall lower and chose to sell, there was a faction fighting for the price to turn around by buying the dip. Stochastic RSI has been moving toward the oversold zone and was under the signal line. This was a sign of the high selling pressure and as RSI moved lower, the price could follow the trend.
The fall of DOT’s value also resulted in money leaving the market. The sellers who realized profit and pulled out were waiting for an entry point. As the price continued to trend lower, we may have to wait until money re-enters the DOT market. Chaikin Money Flow dropped under the zero mark as bearish volatility set in which hinted at money exiting the market. As CMF remained at -0.13, the downward pressure in the market may prevail.
Conclusion
The Polkadot market was witnessing a bearish volatile market. The selling pressure remained high over the past day and may continue to push DOT’s value down. It could find support at $20.56, but if it fails, the asset may be heading to $19.7.


