Polkadot Price Analysis: 15 January

Disclaimer: The findings of the following analysis are the sole opinions of the writer and should not be taken as investment advice
The past 60 hours have been bullish for Bitcoin. The $34k-$34.5k region served as support and saw BTC climb back to touch $40k. However, it was unable to stay there as selling pressure forced it lower on the charts again. In fact, the world’s largest cryptocurrency was trading at $37,529, at the time of writing.
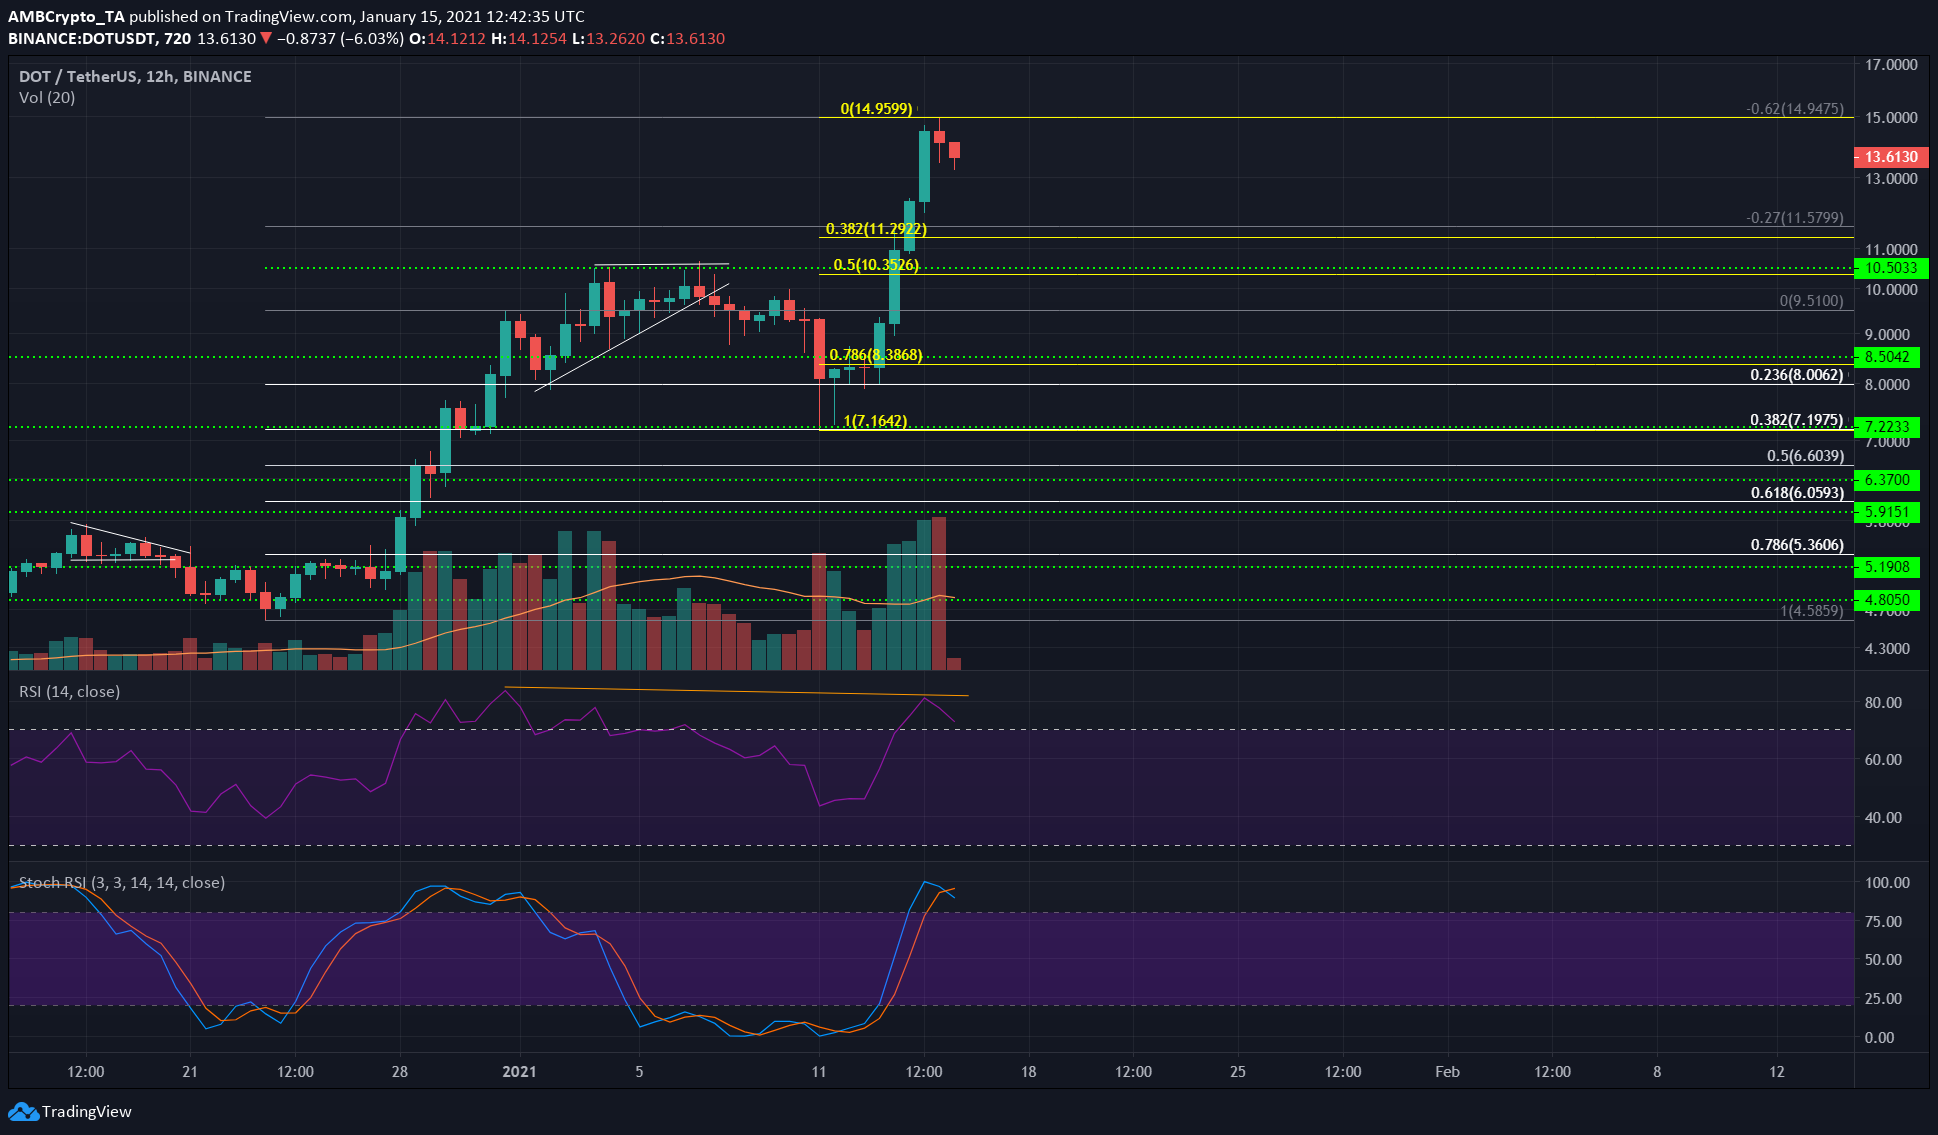
Bitcoin’s recent movements have affected Polkadot’s prices as well. DOT registered the beginnings of a bearish divergence and alongside BTC, slipped by nearly 8% in 24 hours. At press time, it seemed like it could be heading further south again.
DOT 12-hour chart

Source: DOT/USDT on TradingView
A divergence between the price and momentum indicators like the RSI does not necessitate an immediate pullback. However it is definitely one to keep an eye on to indicate weakening momentum, and DOT displayed a bearish divergence as it formed a high at $14.95.
It faced some selling pressure alongside both Bitcoin and Ethereum, but because of the strong recent gains for DOT, it might be forced to undergo a deeper correction in the coming days.
This would be a healthy pullback and can be considered a buying opportunity.
Reasoning
Using the Fibonacci retracement tool for two moves – one from $4.58 (white) and the other from the recent dip to $7.16 (yellow), some levels of retracement can be highlighted.
The confluence between these levels and horizontal support levels indicate regions where DOT can find strong support in the weeks to come. Above $10.5, DOT does not have much history in terms of price action and hence, the retracement level confluence, alongside smaller timeframe analysis, gives support levels for a possible retracement.
The $11.3-$11.5 and the $10.35-$10.5 regions are the strongest and closest areas of support on the longer timeframes, while $12.5 can also halt selling pressure.
Scalp short trades to $12.5 can be opened but trading against the trend is inherently more risky. Hence, buying at these levels is recommended.
Conclusion
Polkadot seemed to be enjoying a bullish outlook on the longer timeframe, but a minor pullback can be seen for DOT. This would present a buying opportunity. Polkadot climbed to fifth on CoinMarketCap by market capitalization, after briefly climbing above XRP. In the coming weeks, Polkadot might be able to claim XRP’s spot on the list as its own.


![dogwifhat's [WIF] 3-day rally has eyes glued, yet a hidden risk lurks](https://ambcrypto.com/wp-content/uploads/2025/04/Gladys-8-400x240.jpg)
