Polkadot Price Analysis: 18 May

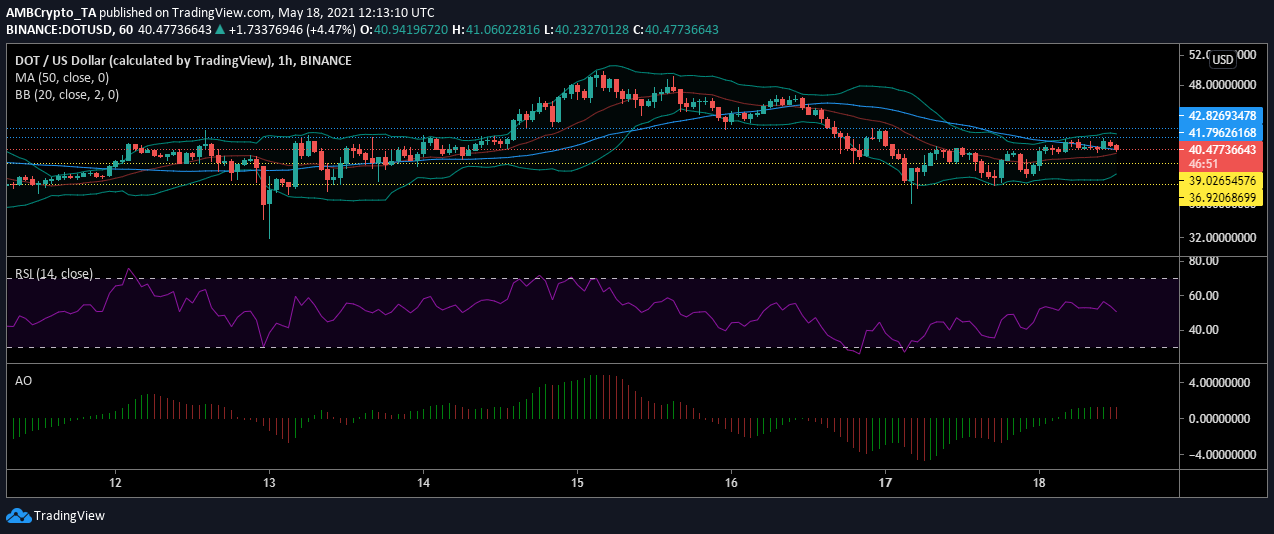
Polkadot’s price has been seeing a continuous drop in price and the market has remained volatile. As the value of DOT toppled from $46.74, it found support at $36.92. Even though the value recovered from this point, Polkadot hit resistance at $41.79.
At the time of writing, the digital asset was trading at $40.47 with a market capitalization of $38.41 billion.
Polkadot hourly chart

Source: DOTUSD on TradingView
As the market once again witnessed sellers taking over, value of DOT was falling once again. The asset hit resistance and turned around. However, the Bitcoin price was also losing ground and this could have had a ripple effect across the crypto market.
DOT may have found support close to $38.79.
Reasoning
Bollinger bands remained diverged suggesting some volatility, but as the price stumbled, signs of volatility entering the market were noticed. As the price collapsed, signal line also moved above the candlesticks, indicating the price had been trending lower. As the price stumbled, it may hold on to support at $38.79 and consolidate.
Relative strength index provided a clearer picture of the selling pressure and the recovery that followed. As the value of the indicator remained at 43, selling pressure was dominant and buyers may have to push to stabilize the market. However, the 50 moving average may offer resistance.
Awesome Oscillator was suggesting that momentum in the DOT market was also reducing with the falling price. The momentum was picking up but the sudden drop pushed the bears in the market.
Conclusion
The current Polkadot market has been volatile and the price was trading lower. The shift in volatility could have been the result of an unstable Bitcoin market. As the DOT value strives to recover, $28.79 will act as strong support. The buying pressure may need to rise to maintain the price at this point.


