
Disclaimer: The findings of the following analysis are the sole opinions of the writer and should not be taken as investment advice
Polkadot’s price has been on a steady incline this month after having had to endure a rough period of sideways movement throughout the latter half of January 2021. However, with the crypto’s price inching closer to its next level of resistance, the question on many traders’ minds will be whether more price discovery is on the horizon or whether a pullback is more likely.
At the time of writing, DOT was being traded at $31.6, with the crypto having a registered market cap of over $27 billion. In the last 7 days, DOT has seen its value appreciate by close to 23 percent. However, thanks to a minor dip in price in the last 24-hours, the market’s bears may be slowly regaining control of the market.
Polkadot 1-day chart
Source: DOT/USD, TradingView
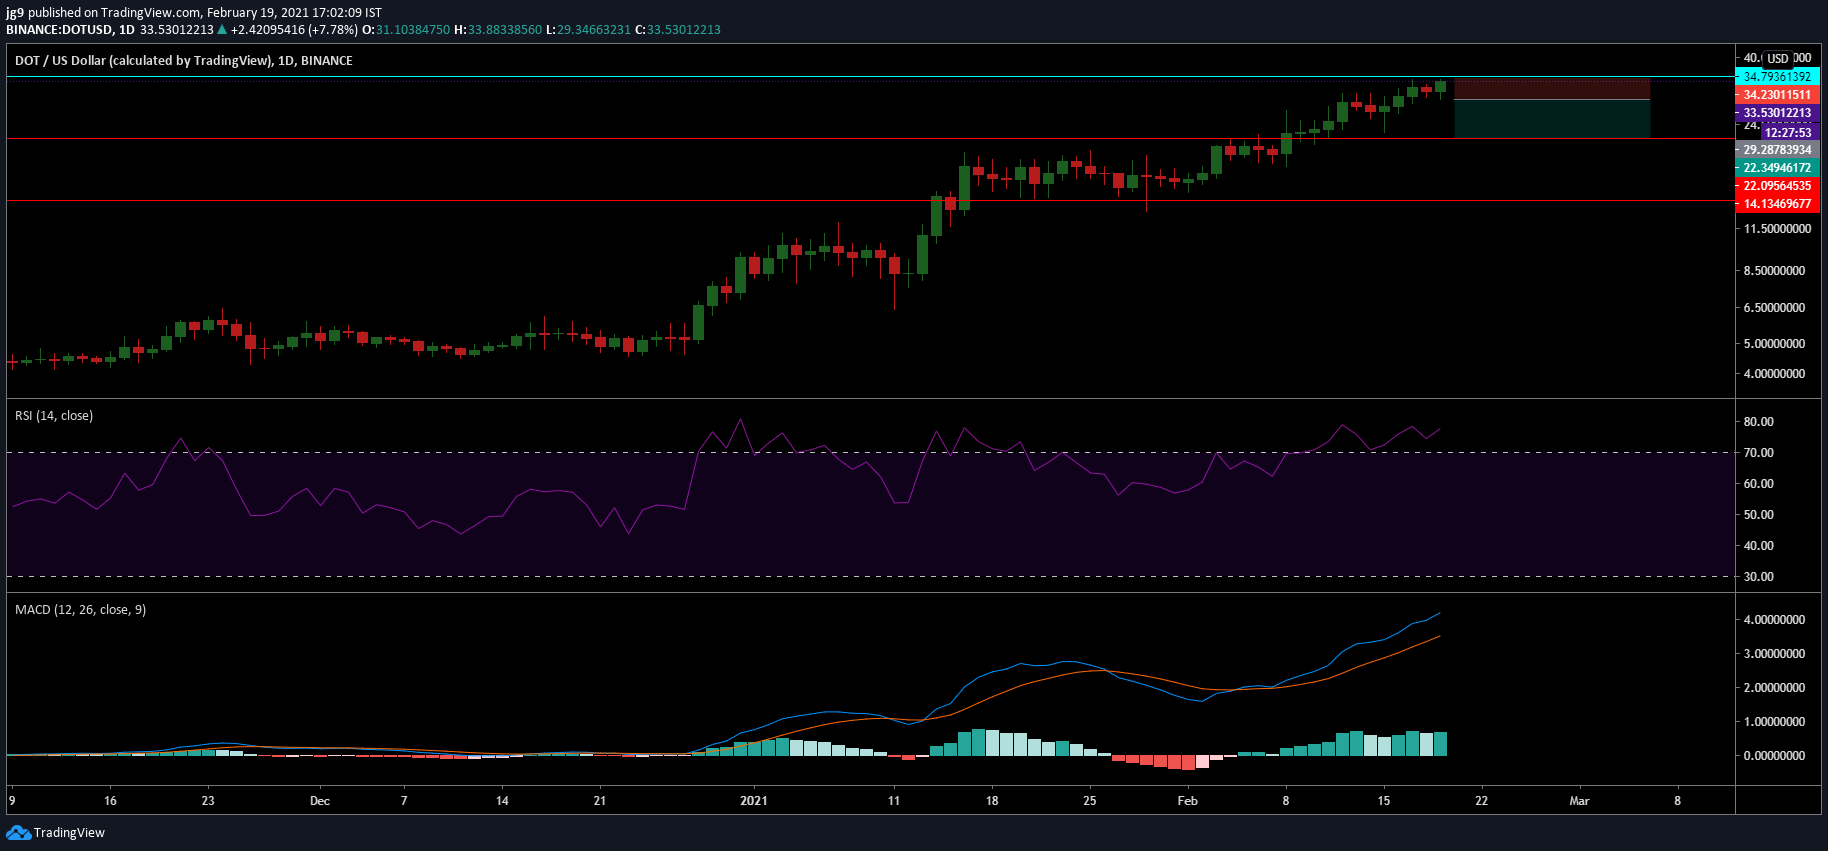
The longer time frame charts for Polkadot illustrated the clear uptrend the coin has been on. However, a slight dip in bullish momentum did take place over the last 24 hours. While there didn’t seem to be much cause for concern, if DOT fails to breach the resistance level at the $34.7-price point, then a minor correction may soon be a reality for the cryptocurrency.
In such a situation, Polkadot is likely to see the price retrace to its first support around the $22-price range. If this unfolds, traders can benefit from a short position, and given the fall in northbound momentum, this is going to be a likely reality for DOT in the near future.
Rationale
As per the coin’s technical indicators, a trend reversal may be in the works. The RSI indicator seemed to be heading out of the overbought zone, highlighting a fall in the number of buyers in DOT’s market.
Interestingly, the MACD indicator, after having undergone a bullish crossover, didn’t show signs of an imminent reversal. However, the Signal line continued to rise on the charts and continued to move towards the MACD line.
Important levels to watch out for
Resistance: $34.7
Support: $22, $14
Entry: $29.2
Take Profit: $22.3
Stop Loss: $34.2
Risk/Reward: 0.83
Conclusion
DOT’s price has been on a steady incline lately but at the time of writing, had witnessed a slight dip in bullish momentum. In the coming weeks, if the coin continues to fail to breach the resistance level, further price discovery for DOT is going to be temporarily put on hold and one can expect a minor price correction.