Polkadot rises strongly, but how high can it really rally

Disclaimer: The findings of the following analysis are the sole opinions of the writer and should not be considered investment advice
Bitcoin has registered steady gains over the past week, while Bitcoin’s dominance fell slightly from 42.6% to 41.6% over the past few days. This suggested that altcoins are primed to post good gains on lower timeframes. However, the long-term outlook for Polkadot remains bearish.
The lows of the previous move lay at $20.6 and offered a nice area for short sellers to enter the market. Can Polkadot bulls drive the prices higher, or will a large number of market participants be caught offside if Polkadot does indeed experience another leg downward?
DOT- 1 day chart

The $20-area (cyan box) has been an area where the price found significant demand in mid-2021. Over the past month, strong selling forced DOT to crash right past this level and retest it at the time of writing.
There was some demand driving prices higher, but not a huge amount. This hinted at weak bulls.
Price always seeks liquidity. A move past the $20-round number resistance has already instilled some faith in DOT over lower timeframes. The $22.6-$23.5 area has a confluence of resistances, based on Fibonacci retracement levels, horizontal support/resistance levels, as well as an area where demand was visibly exhausted over the past month.
A move to this area would be a logical bearish retest before a move south once more.
Rationale
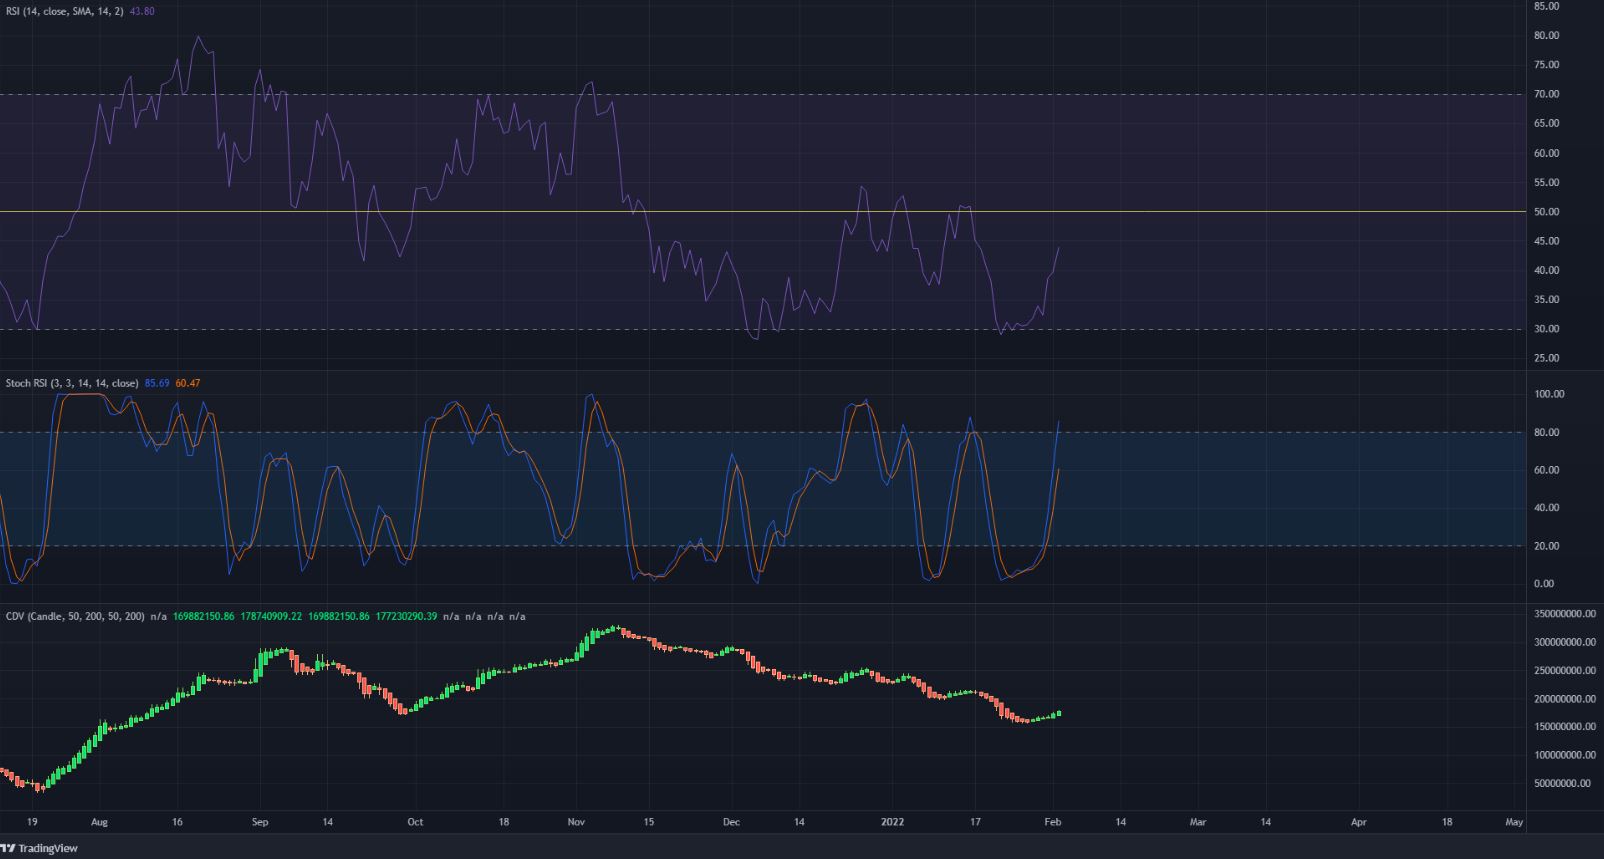
The RSI on the daily has stayed resolutely below the neutral 50-mark despite repeated attempts over the past few weeks. At the time of writing, the RSI was climbing, but was only at 40. This showed that the momentum was not yet bullish, but it was likely just a relief rally.
The Stochastic RSI also seemed to be nearing the overbought area.
The Cumulative Volume Delta highlighted how the past few days have seen very little buying volume despite a nearly 15% bounce from the lows near $16.7. Demand was weak, and the market structure continued to remain bearish.
A break above $28.48 would be necessary to show a convincing higher high. That level was a long way from where Polkadot was trading at the time of writing.
Conclusion
It appears likely that the $22.6-$23.5 area would likely see strong selling pressure on Polkadot once more. The recent bounce did not have strong buying volume, so a revisit of $16.7 or even lower could occur in the weeks to come.