Polkadot set to plunge to new lows as…
Polkadot's daily session close below the $5.15 level showed that the higher timeframe bias was bearish alongside a strong downtrend on the lower timeframes.

Disclaimer: The information presented does not constitute financial, investment, trading, or other types of advice and is solely the writer’s opinion.
- The drop below $5.12 hinted at the market’s intention and showed where DOT could find support next.
- Both near-term and higher timeframe bias were bearish.
Polkadot Insider posted encouraging data for investors, citing the blockchain’s growing popularity and a stable number of daily active users. Yet, a recent report highlighted some concerns buyers could have.
Is your portfolio green? Check the Polkadot Profit Calculator
The technical indicators highlighted firm bearish momentum and a strong downtrend in progress. It was likely that Polkadot was on the way to post another move downward measuring 7% or more to the next support level.
Polkadot set to freefall to $4.68 and lower after failing to reclaim $5.2
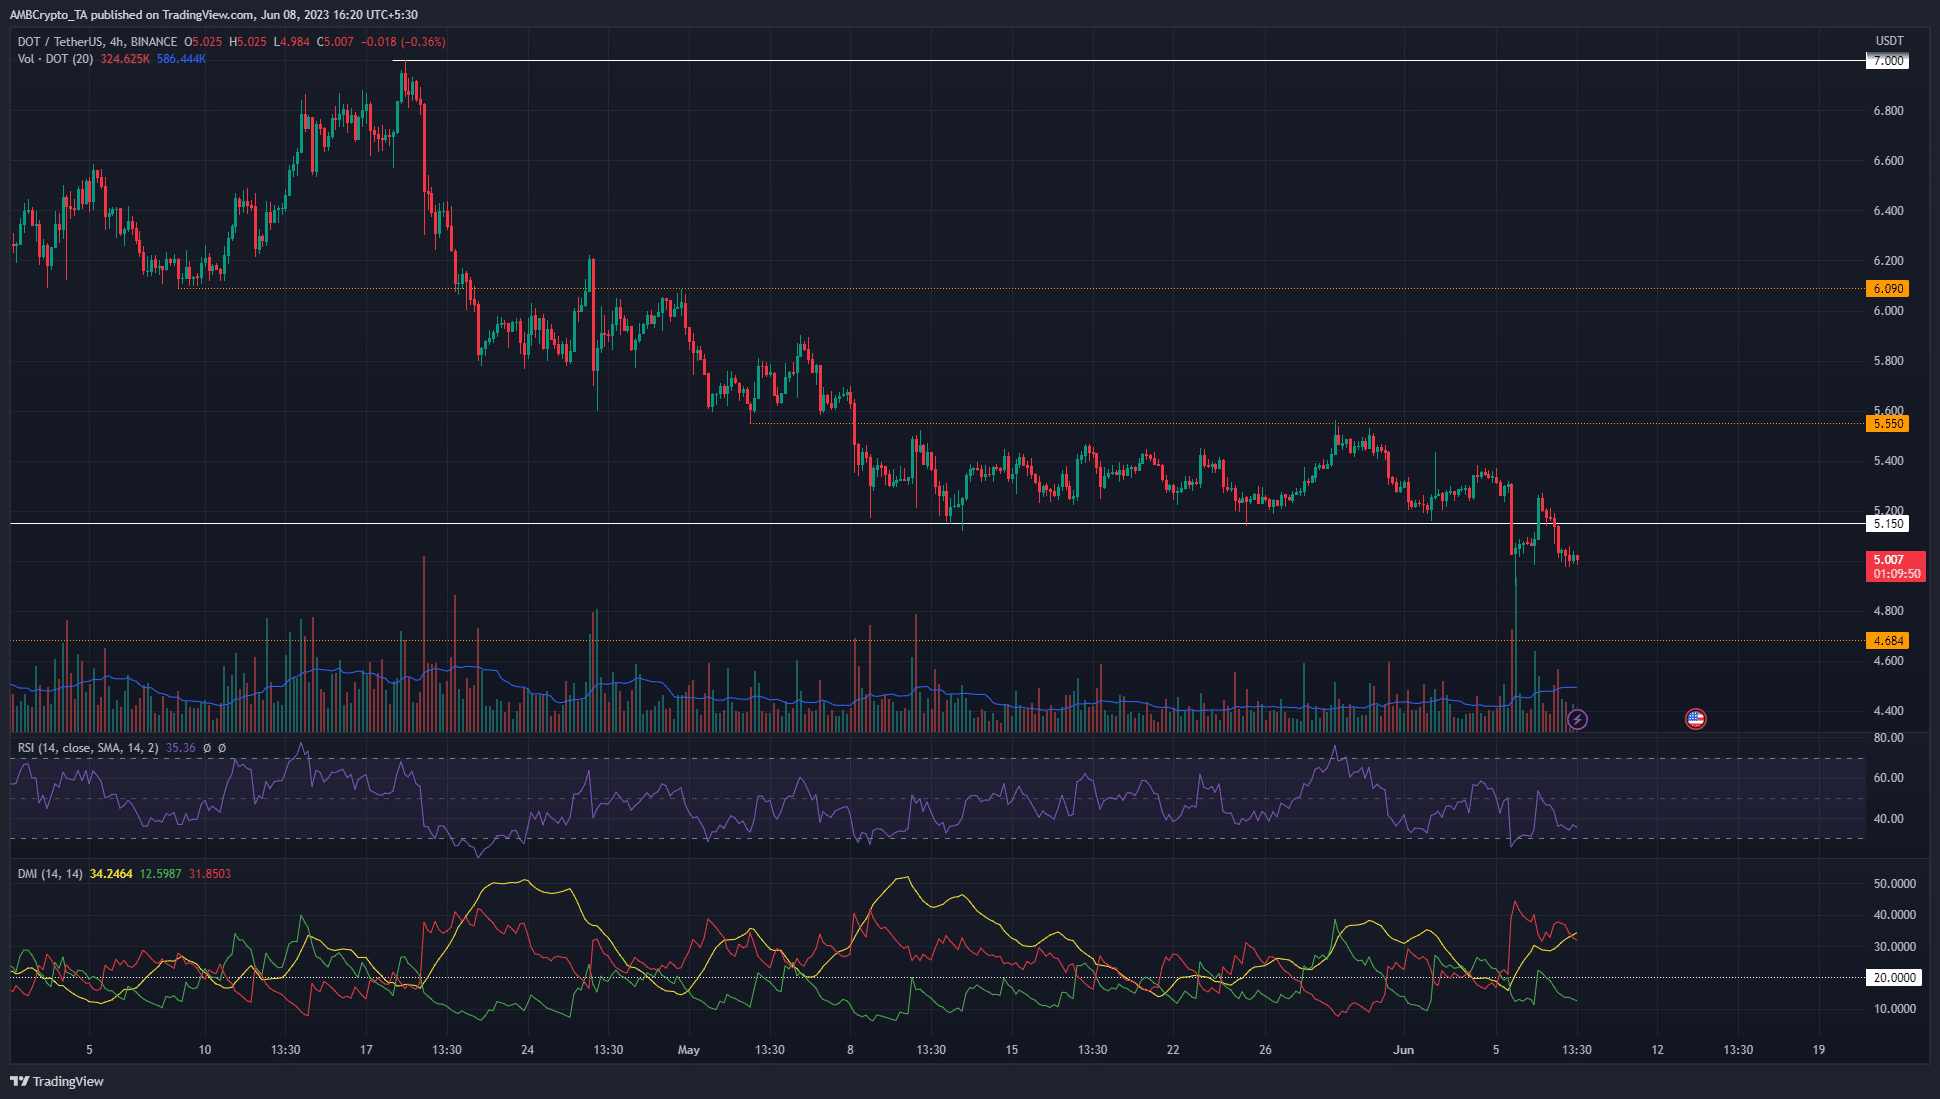
DOT dipped to $5.12 on 12 May and marked it as the lowest price the token reached in that month. The price chart above also highlighted how important the $5.2 zone of support was last month. The buyers were finally overcome on 5 June.
Intense selling pressure saw prices form a new low at $4.9 before bouncing back to $5.27. This was followed by a move back down to $5 at the time of writing. Some of the nearby levels of significance must be explored.
The first is the $5.15 level from the daily timeframe, which represented a higher low following the Polkadot rally in January and February. The fact that the daily session closed below this level once more showed the higher timeframe bias was bearish as well.
The H4 levels at $5.55 and $4.68 are critical as well. $5.55 was the lower low in the downtrend that DOT initiated in late April. This level was retested as resistance on 29 May, affirming the downtrend after the move below $5.11. Another important resistance was $4.68 during Polkadot’s rally in early January, and could serve as support on the way down.
The Open Interest hardly stirred despite the bounce back above $5
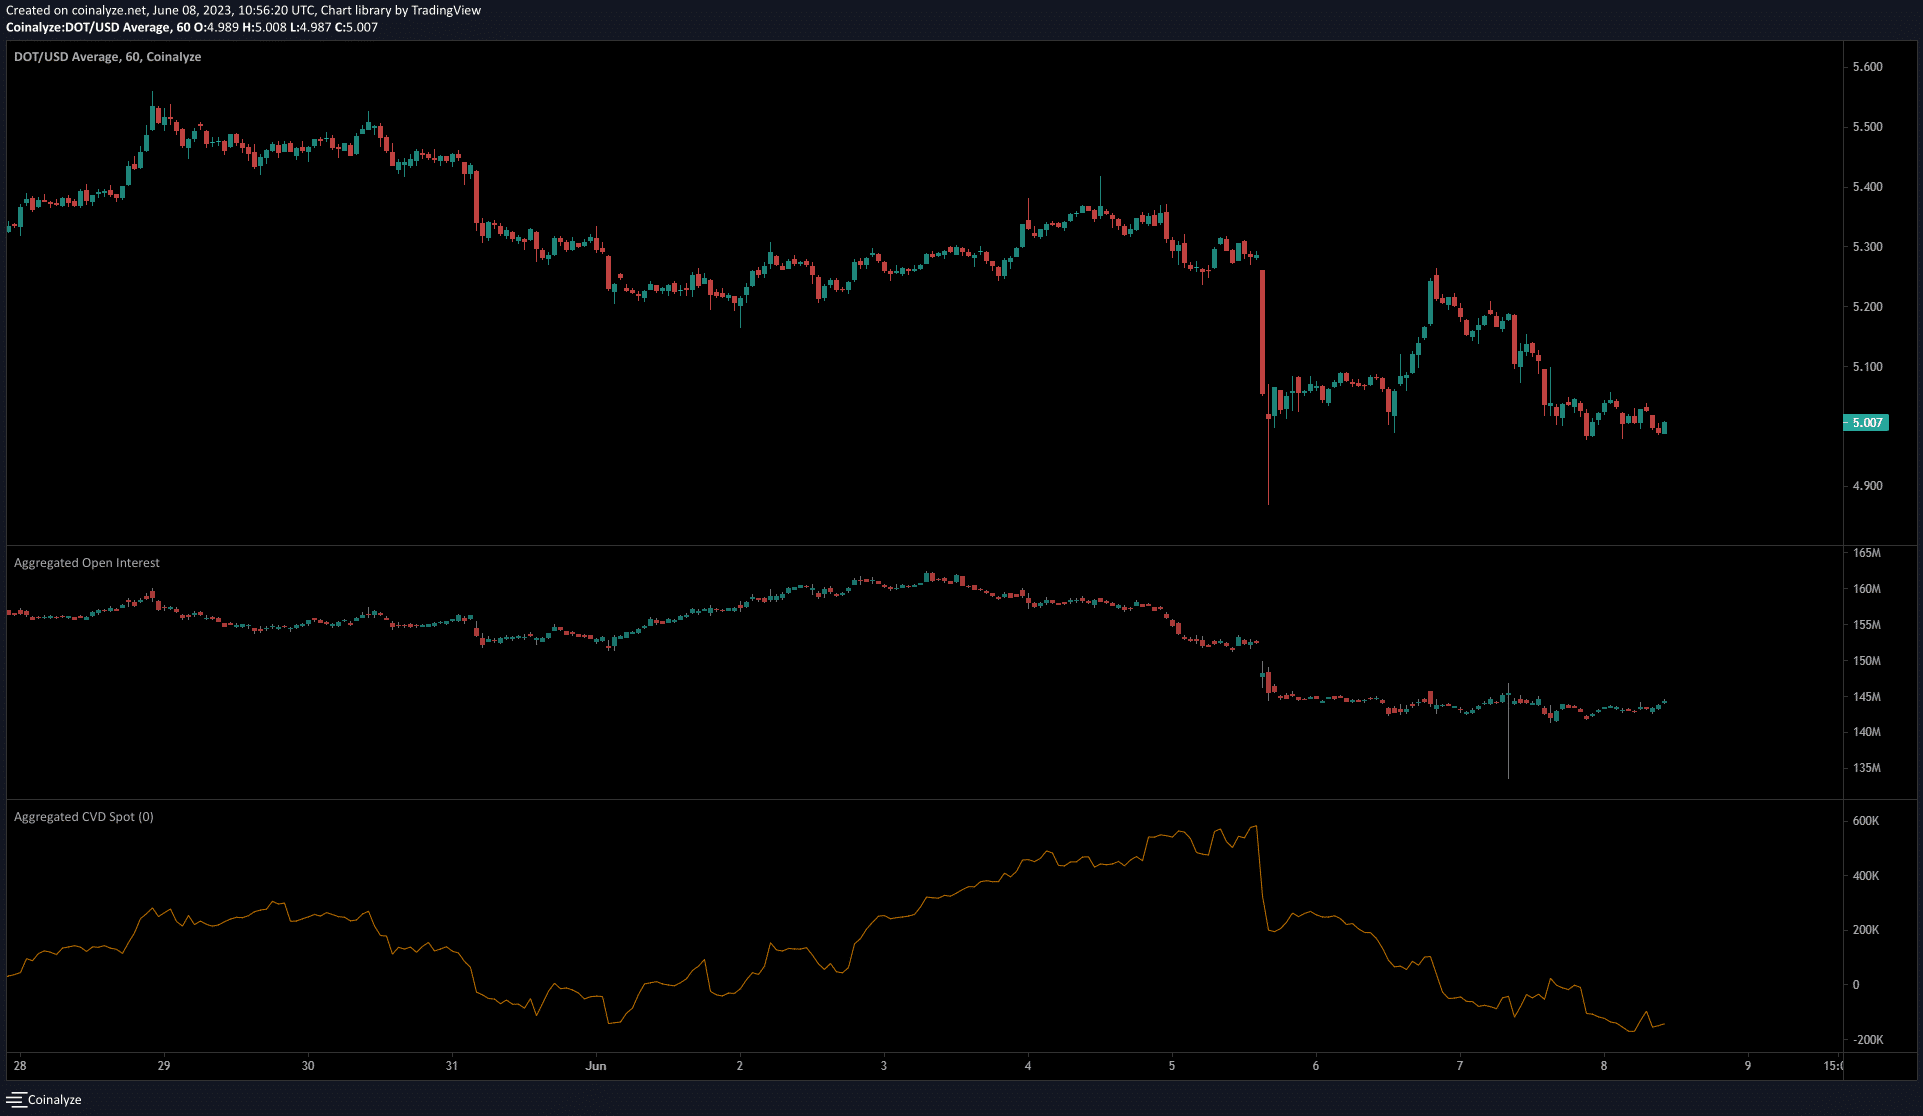
The Open Interest fell dramatically alongside DOT’s descent from $5.3 to $4.9. This was expected because of the strength of the move downward. The spot CVD, which was on the rise till 5 June, began to nosedive, showing rising selling pressure.
How much are 1, 10, or 100 DOT worth today?
What was more interesting was the lackluster OI since that drop. Once again this was not a complete surprise, as it makes sense for speculators to stay sidelined after the strong bearish market structure present on the price charts. Overall, the sentiment remained in bearish control.


