Polkadot, Solana, Terra Price Analysis: 05 January

Although the market sentiment had not yet flipped, DOT’s 20 SMA crossed its long-term SMA’s, hinting at an increased bullish vigor.
Corresponding with the market trajectory, Solana saw a descending triangle and needed to maintain the crucial $167-support to prevent a further breakdown. Further, LUNA broke down from the rising wedge and lost its 23.6% Fibonacci support.
Polkadot (DOT)
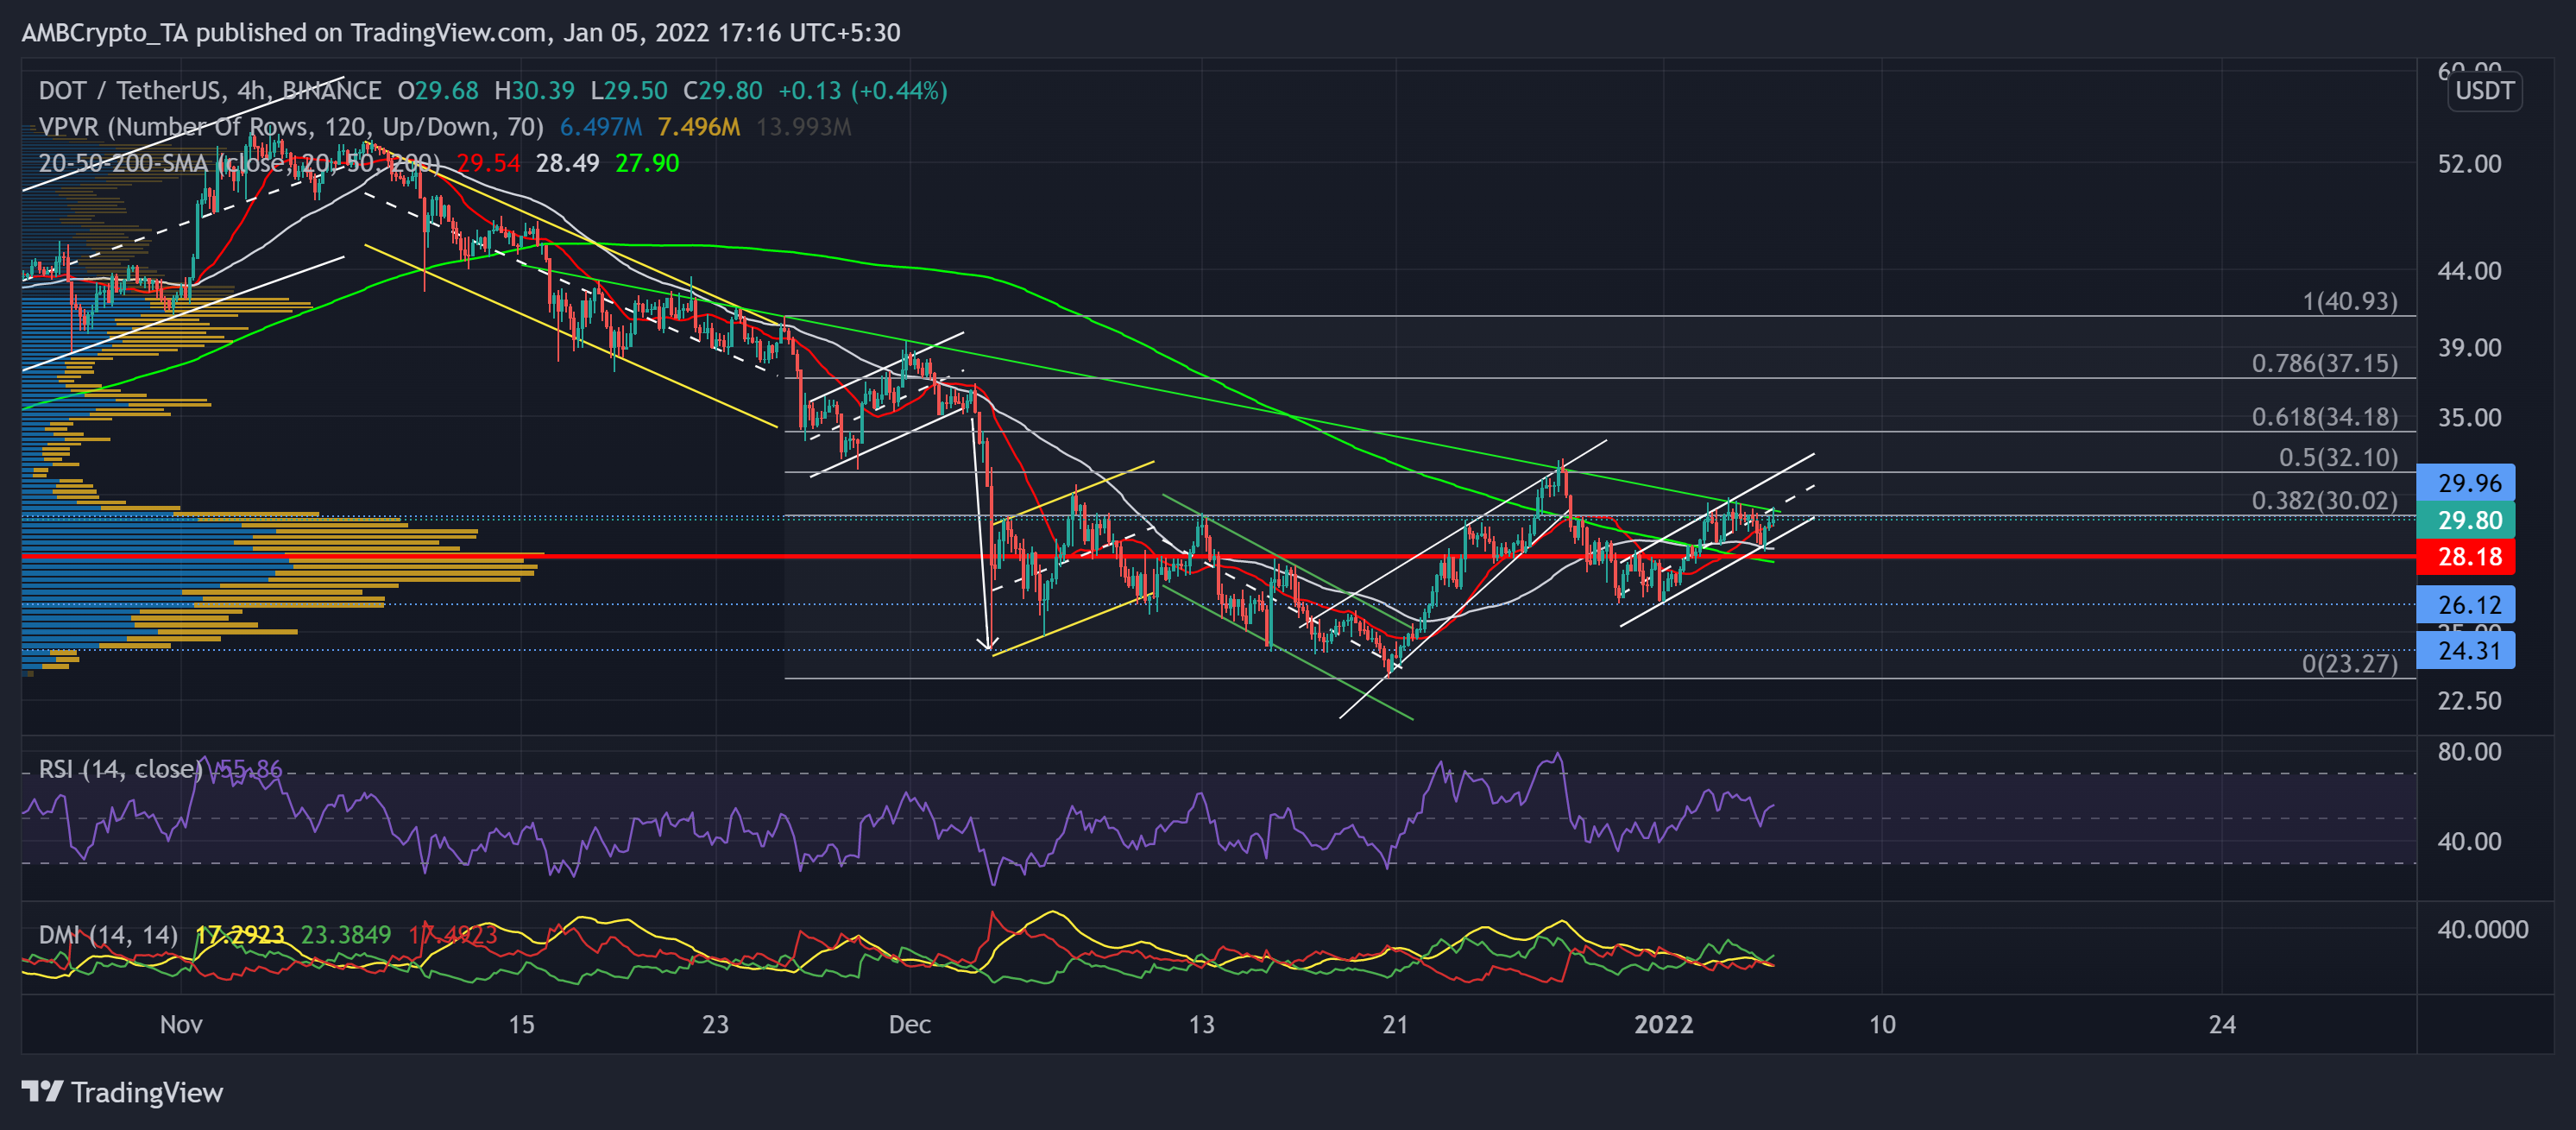
DOT’s rising wedge (white) incline of nearly 40% (from 20 December low) halted at the long-term bearish trendline (green). Then, the 19.95% retracement after the three-week high on 27 December found testing grounds at the $26.12-level.
The bulls retested the 38.2% Fibonacci resistance four times in the past three days after jumping above the ten-week Point of Control (red). The $30-mark was crucial for the bulls to cross as it coincided with the trendline (green) and the Fibonacci resistance.
Now, as the 20 SMA (red) crossed the 50-200 SMA, DOT depicted an increasing bullish influence. At press time, the alt traded at $29.8 after noting a 12.5% ROI in just four days.
The RSI exhibited a bullish preference but seemed to move sideways. Also, the +DI line looked north and reaffirmed the bullish strength. However, the ADX displayed a weak directional trend.
Solana (SOL)
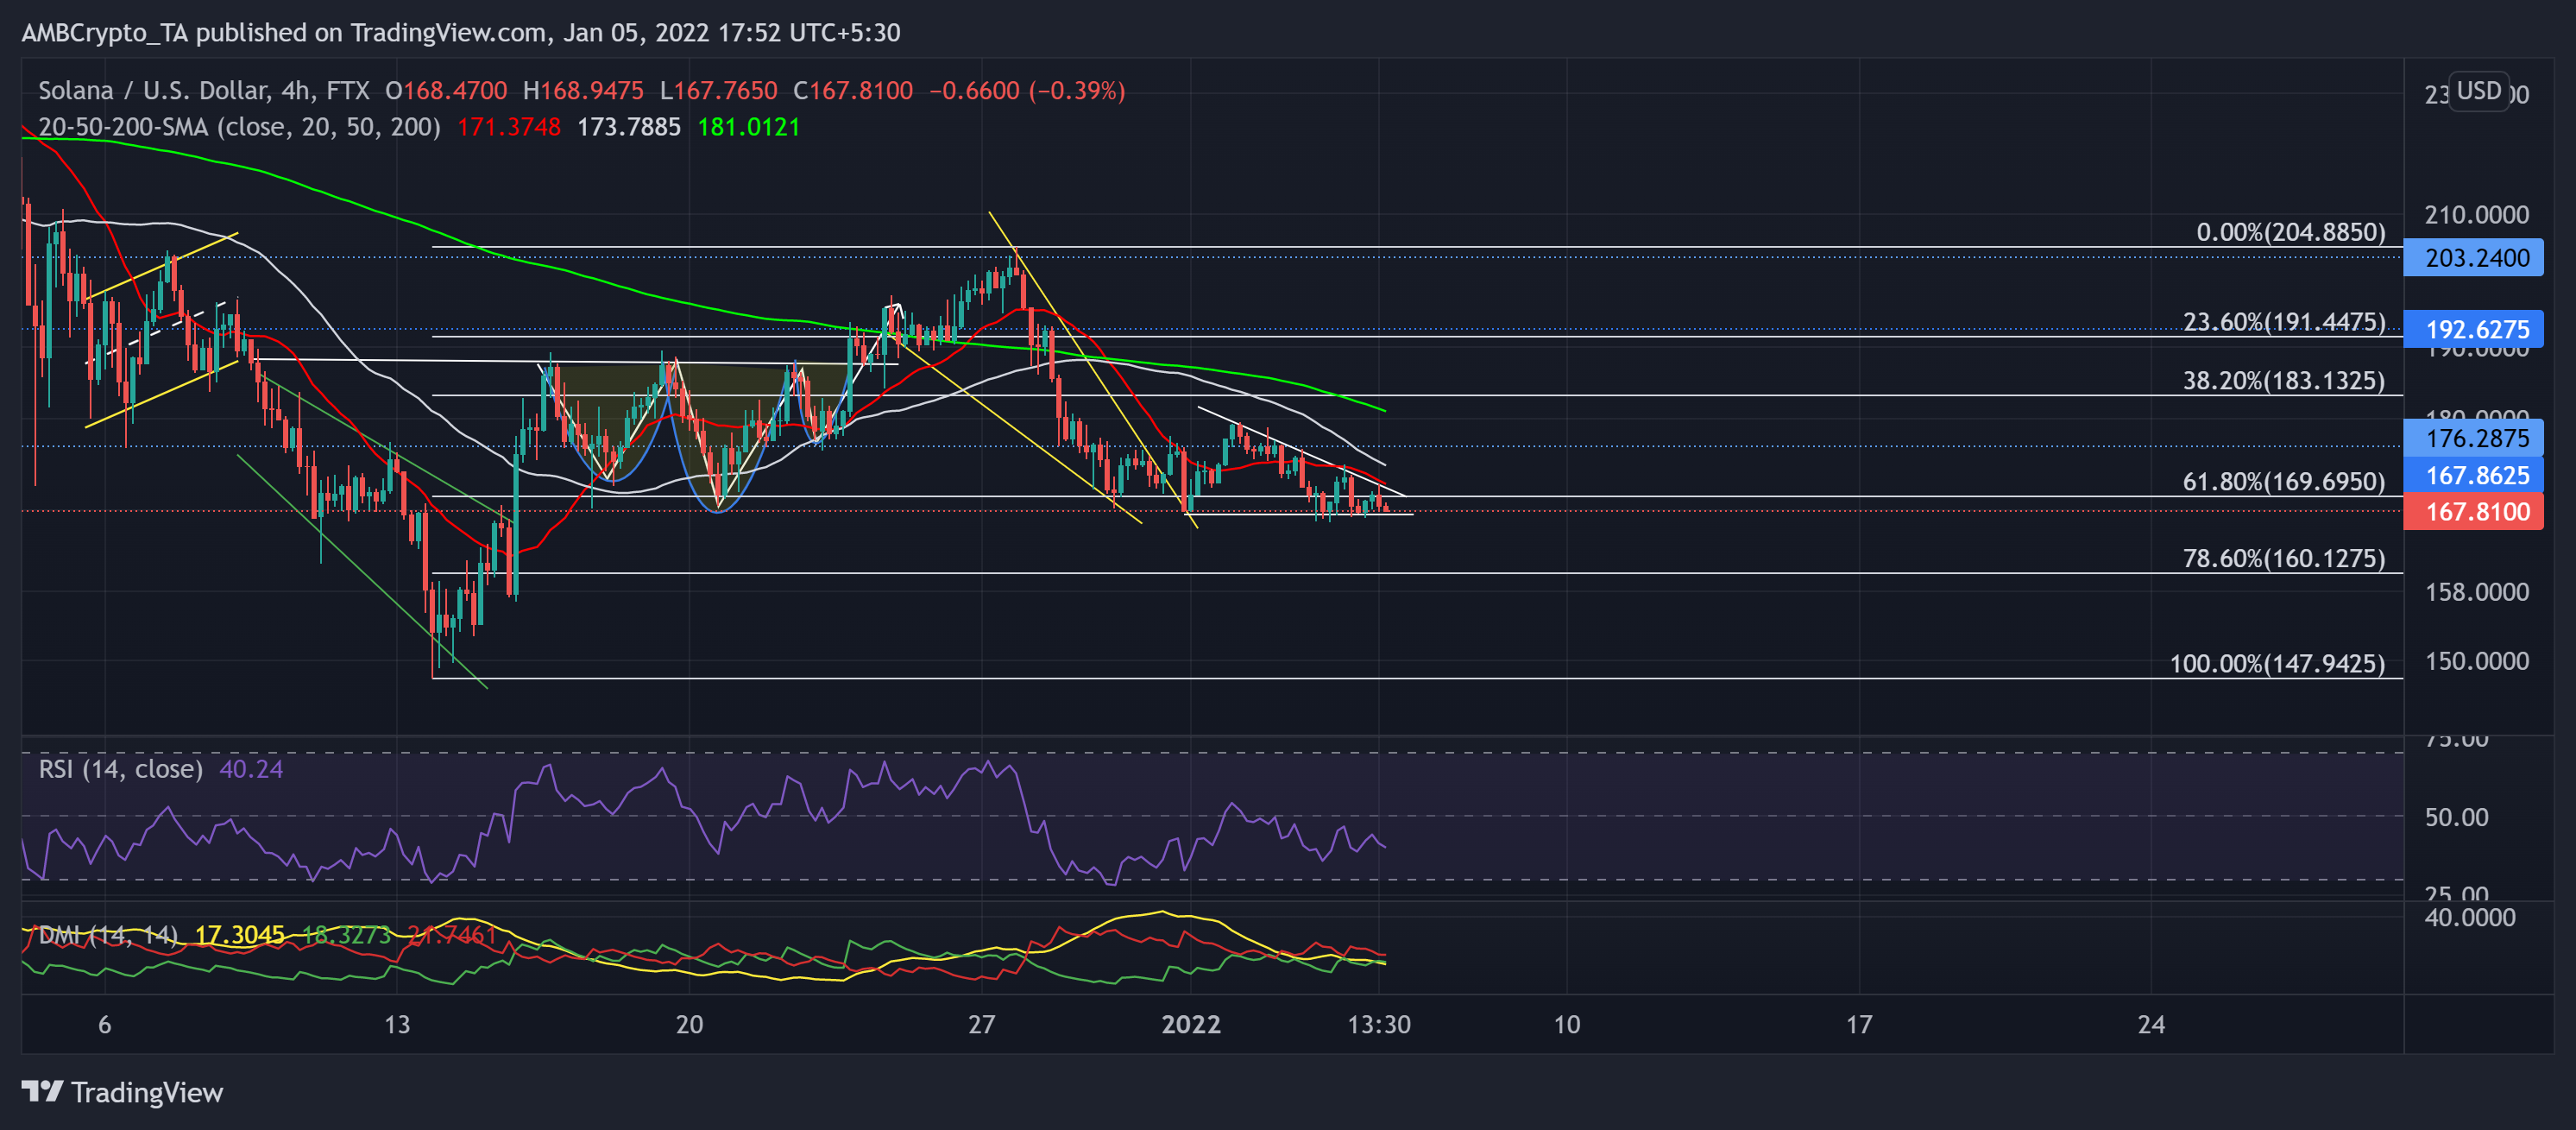
Over the past five days, SOL saw increased selling pressure leading to a descending triangle (white) on its 4-hour chart. The alt fell below its 61.8% Fibonacci support and tested the $167-support multiple times over the past week.
The alt retraced by nearly 17.68% after poking its three-week high on 27 December. While the price action lurked below its 20-50-200 SMA, this level was crucial for the buyers to step in to prevent a further breakdown.
At press time, the alt traded at $167.81. The RSI stood extremely weak after assuming a downward trajectory. Also, the DMI showed a bearish preference while the ADX displayed a weak directional trend.
Terra (LUNA)

LUNA saw a staggering 99.96% up-channel rally (from 14 December low) until it touched its ATH on 27 December.
Over the past two days, LUNA saw an expected rising wedge (green) break down on its 4-hour chart. The alt marked a 9.38% retracement during this time and lost the 23.6% Fibonacci support. Any further breakdowns would find testing support at the $80-level.
At press time, LUNA traded 17.4% below its ATH at $84.22. The RSI was southbound and showed no revival signs at the time of writing. Also, the DMI skewed in favor of the bears, but the ADX displayed a weak directional trend.