Polkadot: The levels to watch out for if a breakdown happens

Disclaimer: The findings of the following analysis are the sole opinions of the writer and should not be taken as investment advice
Polkadot formed a 4-month low when it fell as low as $13 on 22 June. And, although the market has recovered since its price has generally moved within the demand zone of $13.8-$16.8. Taking into account a recent consolidation phase in the broader market, DOT’s movement can be projected to be within a tight channel moving forward.
At the time of writing, Polkadot was being traded at $15.49, up by 2% over the last 24 hours.
Polkadot 4-hour chart
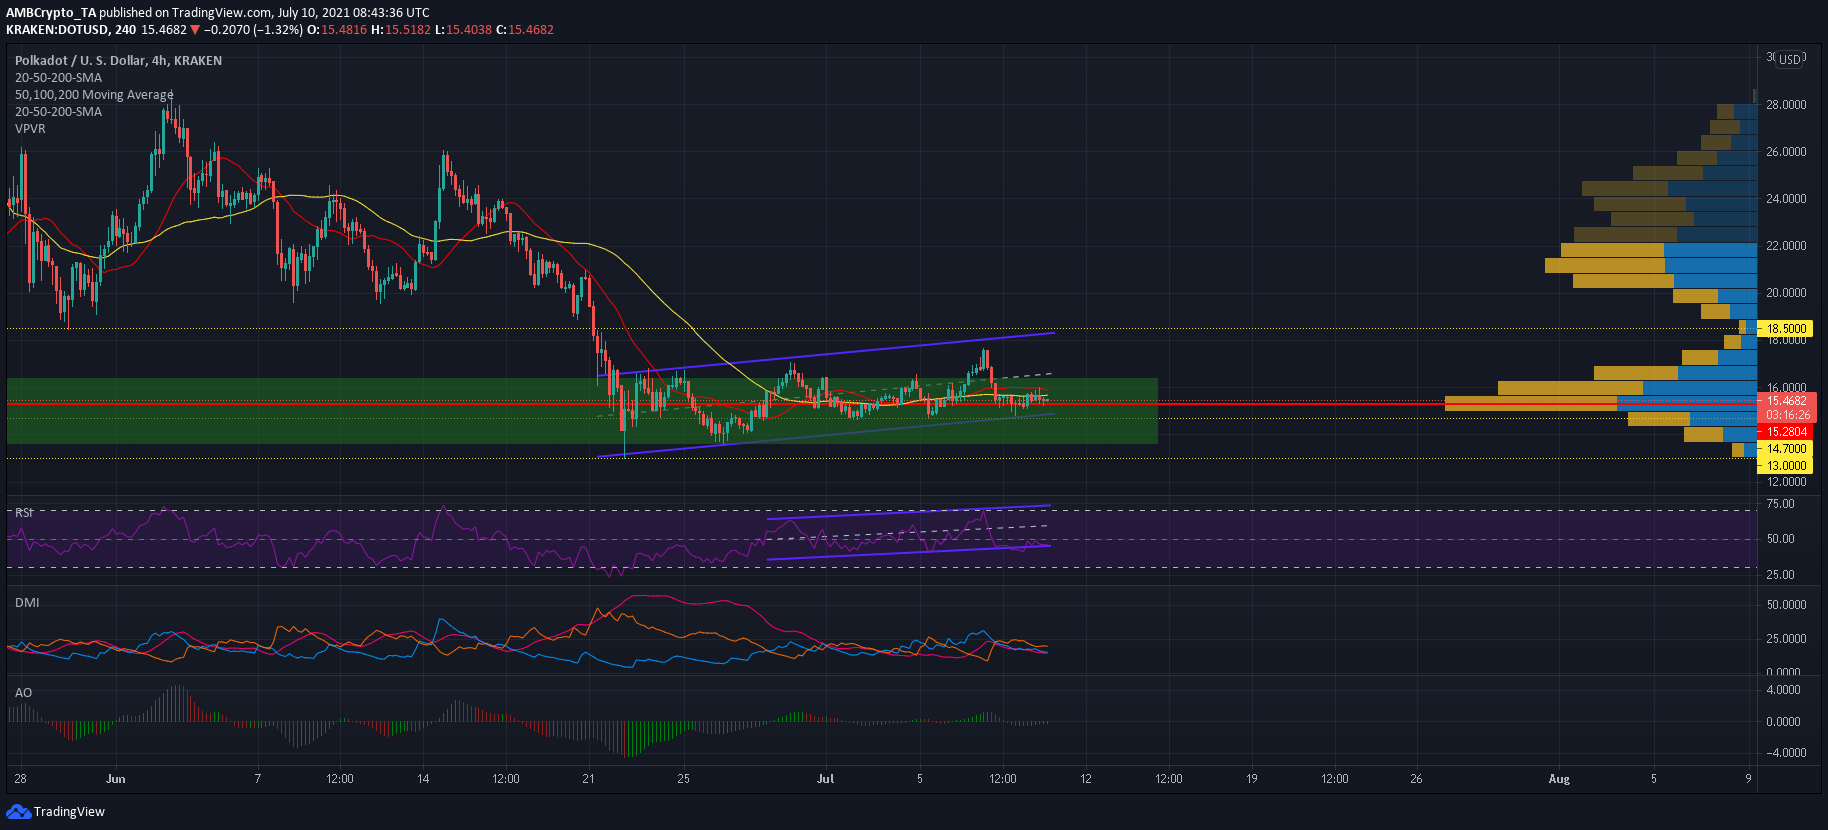
The emergence of an ascending channel allowed DOT to recapture the region above $17.5 but a break above the upper trendline was denied and southbound pressure returned to the market. The 20-SMA (red) and 50-SMA (yellow) flipped bearish once again as DOT remained sandwiched between these lines and the lower trendline of its pattern.
Interestingly, this lower trendline coincided with 2nd and 5th July’s swing low of $14.7, and the Visible Range’s POC lay just above this area at $15.28. Hence, the region between $14.7-$15.28 can be seen as an important defense for DOT with respect to its short-term trajectory. In case this defense in penetrated, the next line of defense would be present at its 23 May swing low of $13.8. Such a price action would mean a decline of nearly 10% from DOT’s press time level.
Reasoning
The Relative Strength Index traded in the neutral territory as some equilibrium was observed between the buyers and sellers. However, a move below the lower trendline would likely see the RSI in bearish territory which would signal a weakening trend.
The Directional Movement Index’s -DI was slightly above the +DI but an ADX reading of 17 meant that the bearish trend was not too strong in the market. In fact, the Awesome Oscillator’s green bars even suggested that some bullish momentum had trickled into the market already. However, minor gains would likely be denied above their 50-SMA unless volatility picks up.
Conclusion
DOT can be expected to stabilize within its defensive region of $14.7-$15.28 as the broader market signals a more definitive direction. However, there have been strong waves of selling pressure of late and the threat of a breakdown cannot be ignored. In such a case, DOT would look to cushion near-term losses at its 23 May swing low of $13.8.