Polkadot, Uniswap, VeChain Price Analysis: 08 May

Polkadot’s up-channel closed in on an important resistance area at $46-49. Uniswap could break south from a descending triangle and head towards $35. VeChain’s breakout was denied above $0.252 and another bullish retake attempt seemed unlikely.
Polkadot [DOT]

Source: DOT/USD, TradingView
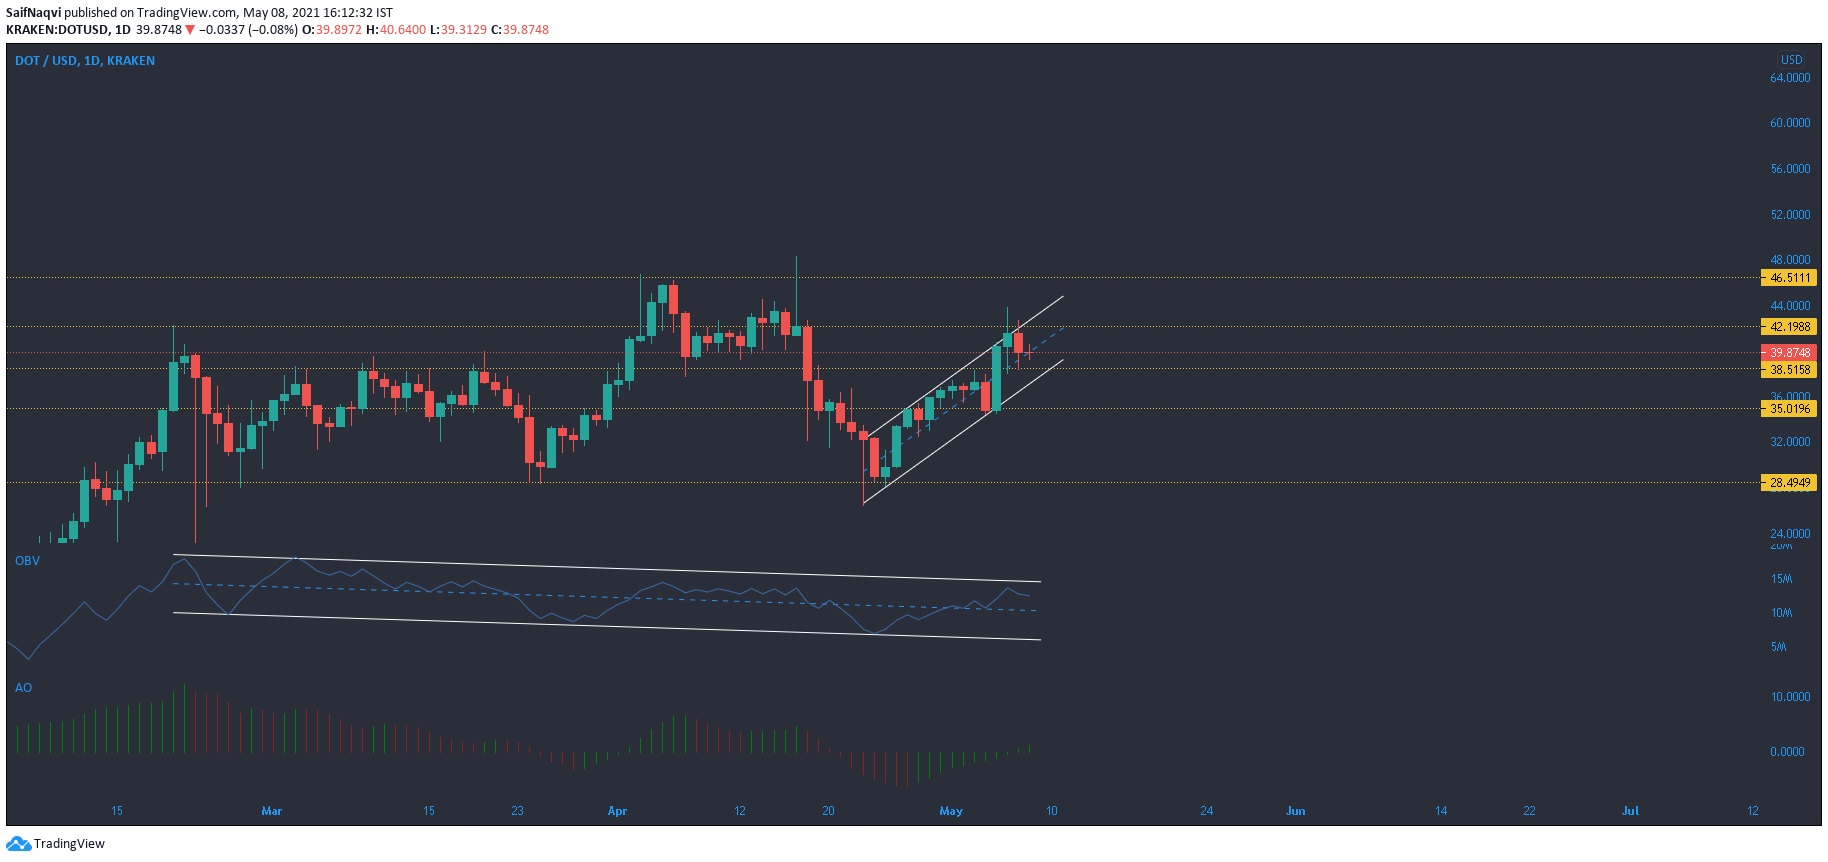
Since April-end, Polkadot has seen an uptrend that saw it increase from $28.5 to $43.8 in just two weeks. During this jump, an ascending channel formed on the daily timeframe and it approached a crucial juncture. If DOT is able to breach $46-49 level in the coming days, the price would likely shoot north and override this bearish formation. OBV moved within a falling channel since late-Feb as buying pressure was on a downtrend. This could come into effect and lower buying pressure could deny a breakout above the aforementioned ceiling.
Conversely, OBV could also see a spike if it manages to rise above the upper trendline. This could see DOT head towards $55-60. Awesome Oscillator noted bullish momentum but not enough to warrant a favorable outcome just yet. When a breakdown occurs, support levels rest at $38.5, $35 and $28.5.
Uniswap [UNI]

Source: UNI/USD, TradingView
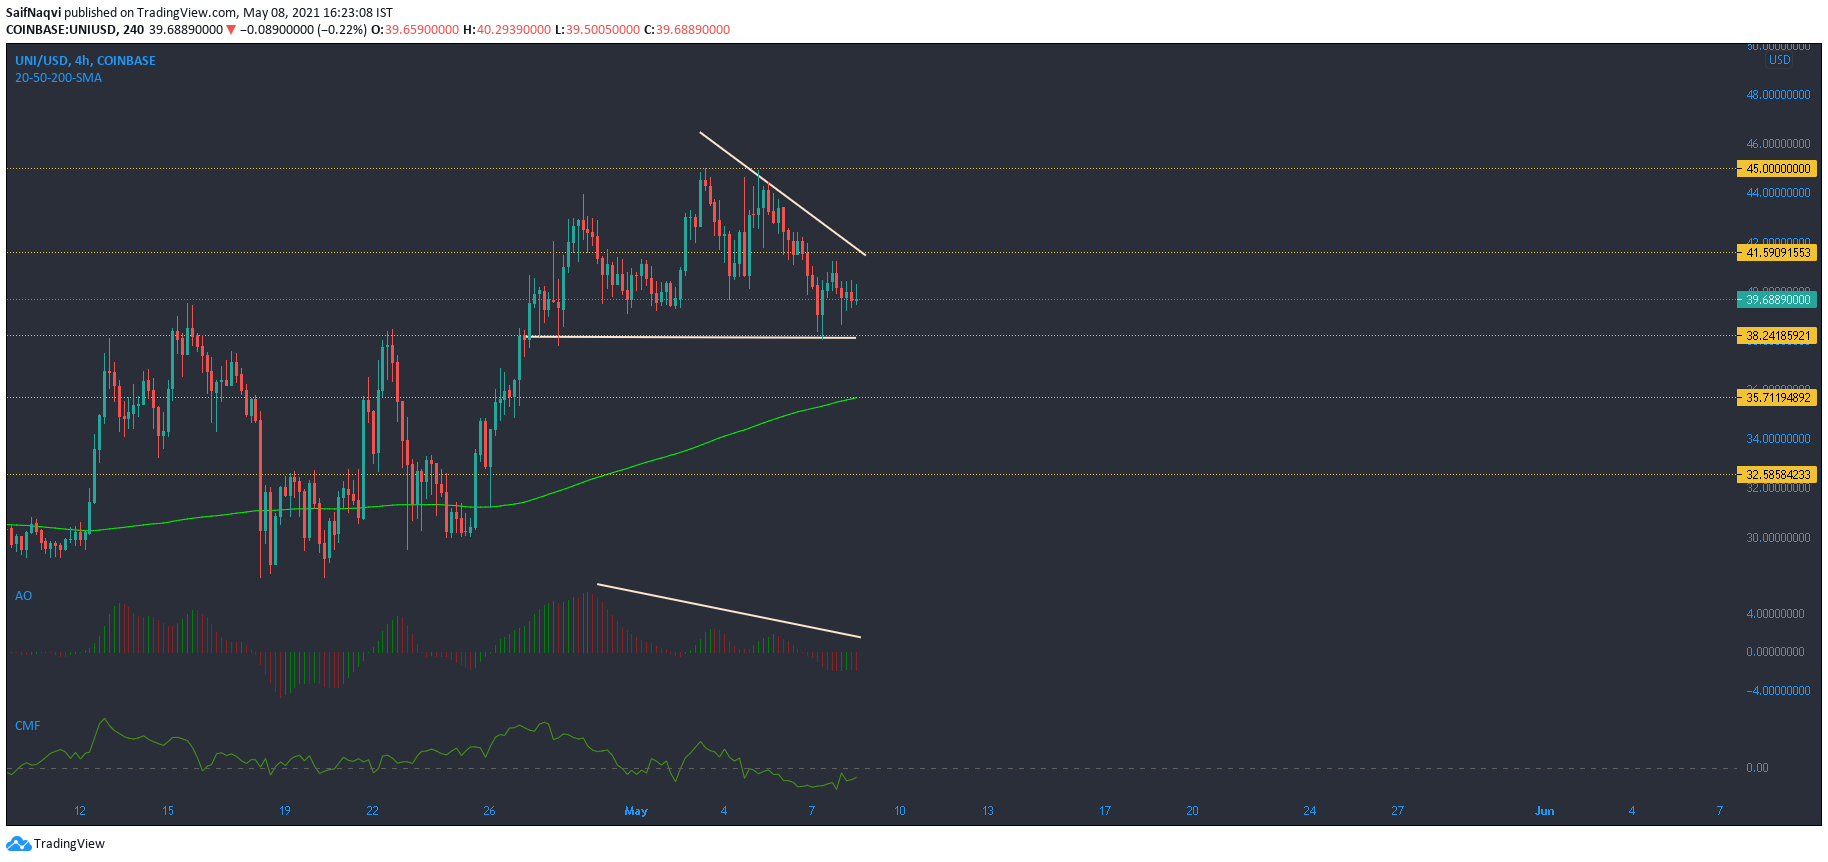
On the 4-hour timeframe, Uniswap made lower highs and traded within a descending triangle. If the $38-mark is turned over to the bearish side, a sell-off could take place towards $35. This support coincided with the 200-SMA (green) and a move below the long-term moving average could see UNI drop close to late-April lows.
Buying momentum has been on a decline and this was highlighted by a downwards-sloping Awesome Oscillator. Capital outflows were also strong as Chaikin Money Flow maintained below the half-line and showed a reading of -0.07. To enable a bullish outcome, UNI first needed to retake the region above $41.6. A rise above $45 could see some more buying but this was unlikely over the coming days.
VeChain [VET]

Source: VET/USD, TradingView
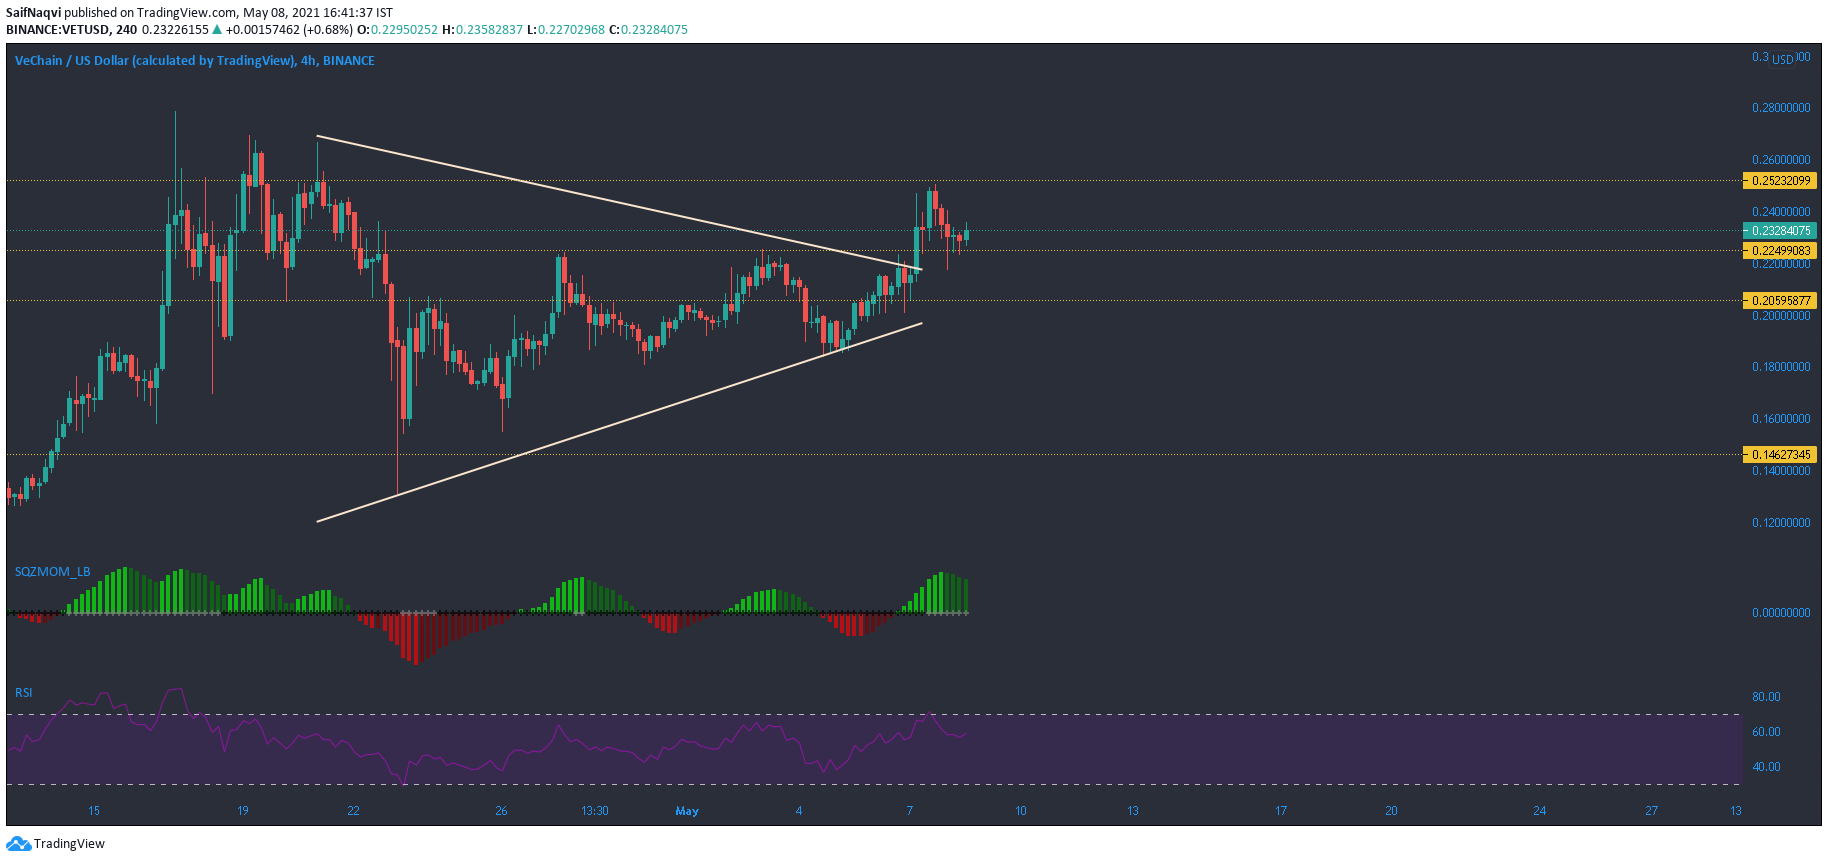
A symmetrical triangle breakout showed gains of over 13% from the upper trendline, but VeChain was unable to fully take advantage as $0.252-level still rested with the bears. The 4-hour charts showed consecutive red candlesticks as sellers denied further upside.
Squeeze Momentum Indicator’s green bars declined but the white dots still indicated some volatility in the market. RSI dropped below the overbought zone and could continue its descent towards 50. If $0.252 is recaptured by the bulls, VET could rise above $0.27. A spike in the 24-hour trading volumes would lead to another price swing.


