
Bitcoin Cash traded within a descending triangle and a move below $1,280 could lead to a sell-off. Ethereum Classic’s down channel could trend even lower before a break to the upside. Lastly, Binance Coin showed a cup and handle pattern and a surge was expected in the coming days.
Bitcoin Cash [BCH]
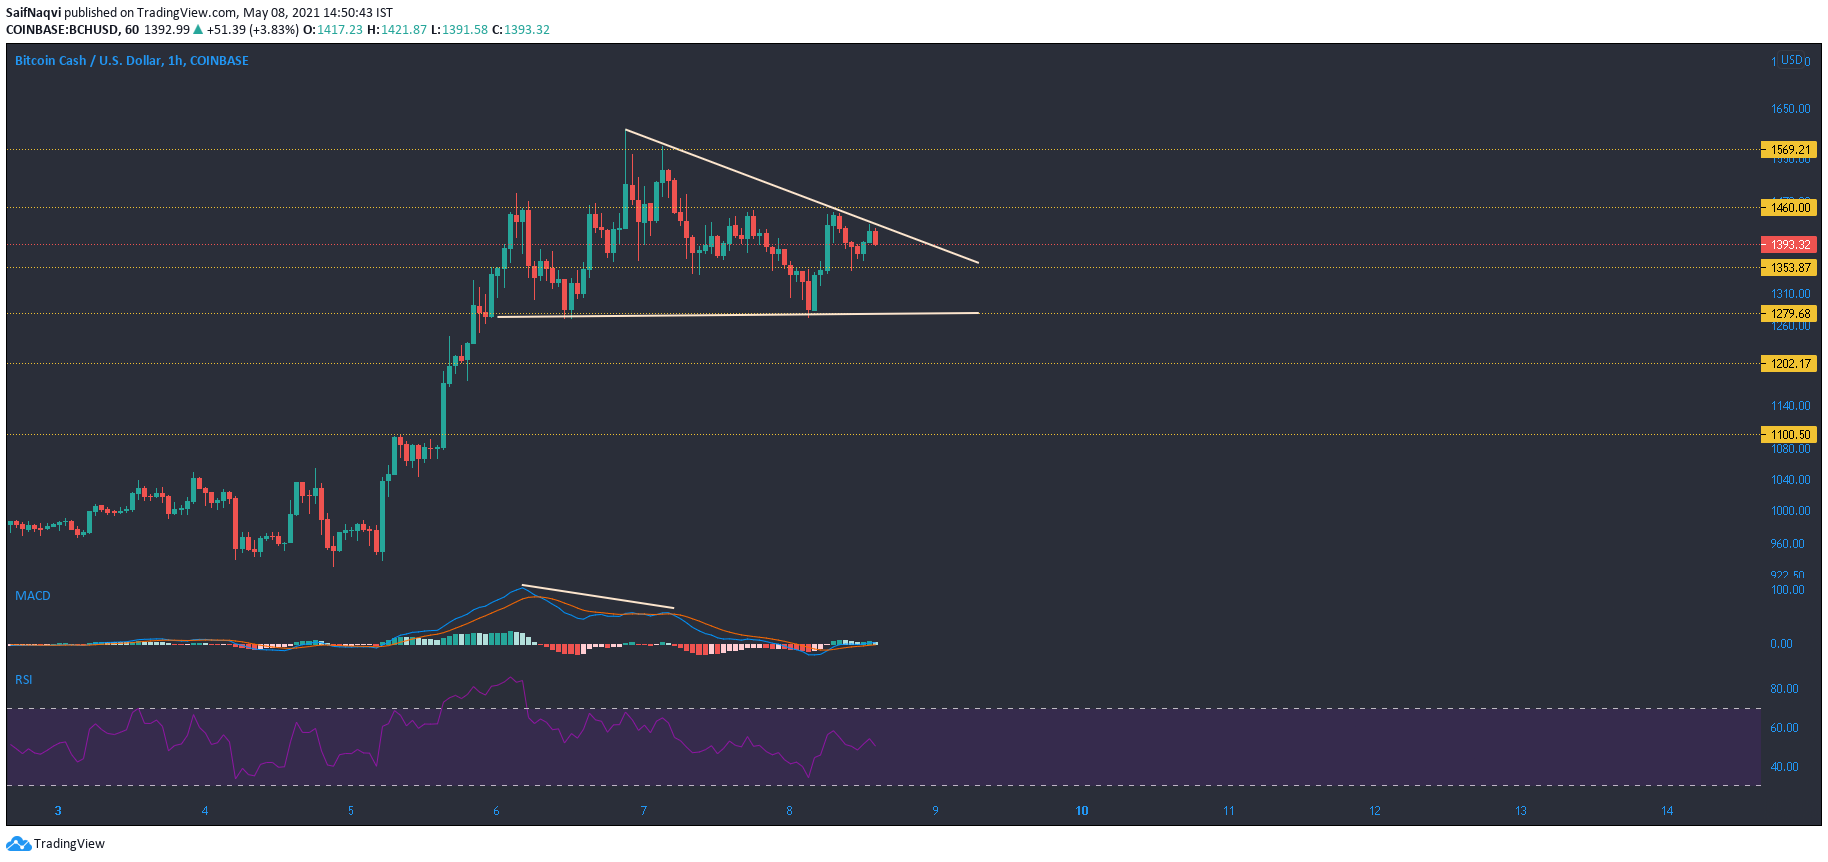
Source: BCH/USD, TradingView
Resistance at $1,460 countered buying pressure as Bitcoin Cash dropped towards $1,400 at press time. On the hourly timeframe, a descending triangle was spotted – a pattern that usually sees a break to the downside. Before this took place, BCH would likely oscillate between $1,420 and $1,280. Breaking north of $1,430 could allow for a bullish outcome and invalidate this pattern, but gains would still be limited.
RSI picked up from 30 and settled around 50, reflecting a degree of equilibrium between buyers and sellers. A fall into the oversold zone would likely see BCH cede the $1,280 level to the bears. This would also lead to a breakdown from the triangle and highlight support levels at $1,202 and $1,100. MACD showed a bearish divergence and remained below the equilibrium mark.
Ethereum Classic [ETC]
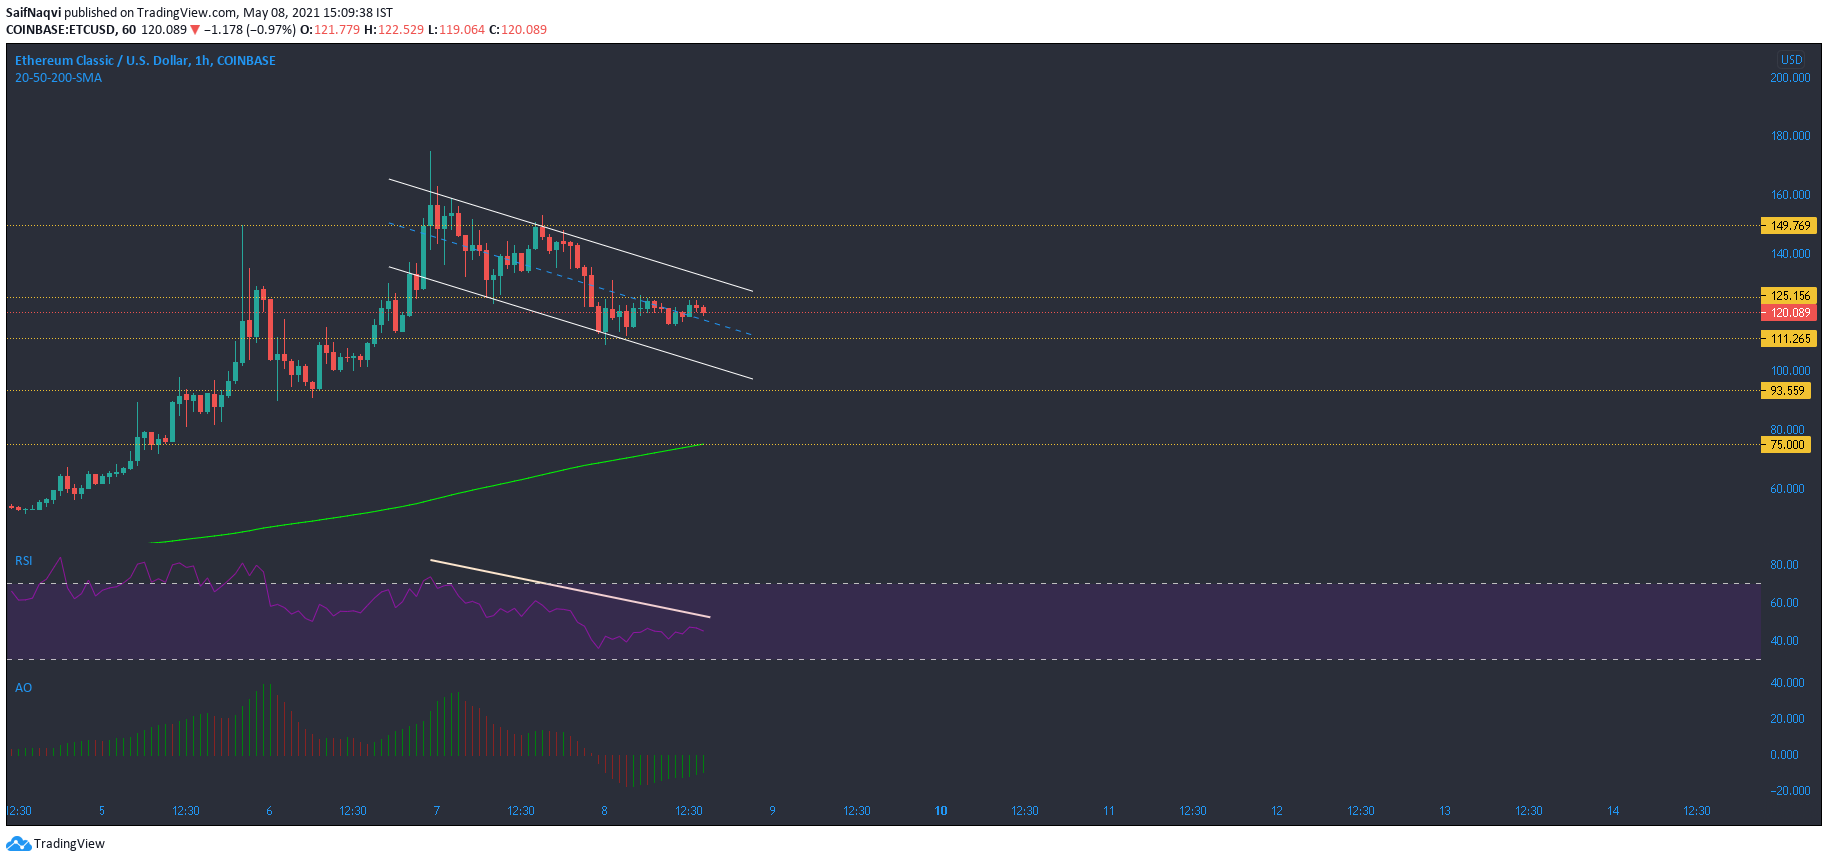
Source: ETC/USD, TradingView
A correction in Ethereum Classic has been forthcoming for quite some time. According to RSI, ETC has largely been overbought since May 1 but high buying pressure has delayed a pullback in the market. This was not the case anymore. On the hourly timeframe, ETC formed a down channel and while this indicates a break to the upside, the channel could peak at lower levels in the coming days.
A break below support at $93.5 could lead to losses all the way towards the 200-SMA close to $75. Awesome Oscillator noted some bullish momentum but it was still below the half-line. The 4-hour timeframe presented the other side of the coin as momentum still rested with sellers.
Binance Coin [BNB]

Source: BNB/USD, TradingView
Binance Coin’s movement over the past 24-hours was largely within expectations as it maintained rangebound behavior. The daily timeframe, however, showed an interesting development. A cup and handle pattern formed on the daily charts and a surge was expected over the coming days.
Before this outcome, BNB would drop lower as pointed out by its technicals. RSI highlighted a bearish divergence, while Awesome Oscillator showed a bearish twin peak setup. A fall below $600 could go low as $470 and this would negate the pattern. If $600 is maintained, a rise above $700 and even $778 was possible over the coming weeks.