Polkadot: Unraveling the effects of the latest rally on DOT’s technicals

Disclaimer: The findings of the following analysis are the sole opinions of the writer and should not be considered investment advice
The market-wide sentiment boost aided Polkadot’s [DOT] bulls in getting a grip on the near-term trend. The previous month has been relatively hopeful as the alt finds a position near the upper band of the Bollinger Bands (BB).
A breach of the $9.11-mark positioned the coin towards the brighter side of market momentum. However, traders should consider the caveats discussed below before entering positions. At press time, DOT was trading at $9.34, up by 8.7% in the last 24 hours.
DOT Daily Chart

The upturn from the alt’s multi-yearly low on 13 July has reignited the near-term buying pressure. This force helped DOT flip its four-month trendline resistance (yellow, dashed) to support. Also, a rising wedge setup came to fruition as a reflection of increasing buying power.
Also, the BB noted a volatile break as its upper and lower bands kept looking away from each other.
Should the current candlestick reverse from the upper trendline of the rising wedge, DOT could see a near-term setback. In this case, potential targets would lie in the $8.2-zone, just above the basis line of BB.
Traders should watch for a reversal from the immediate resistance range to identify the chances of this near-term drop. On the flip side, an extended bull run could be short-lived by the $9.8-mark resistance.
Rationale
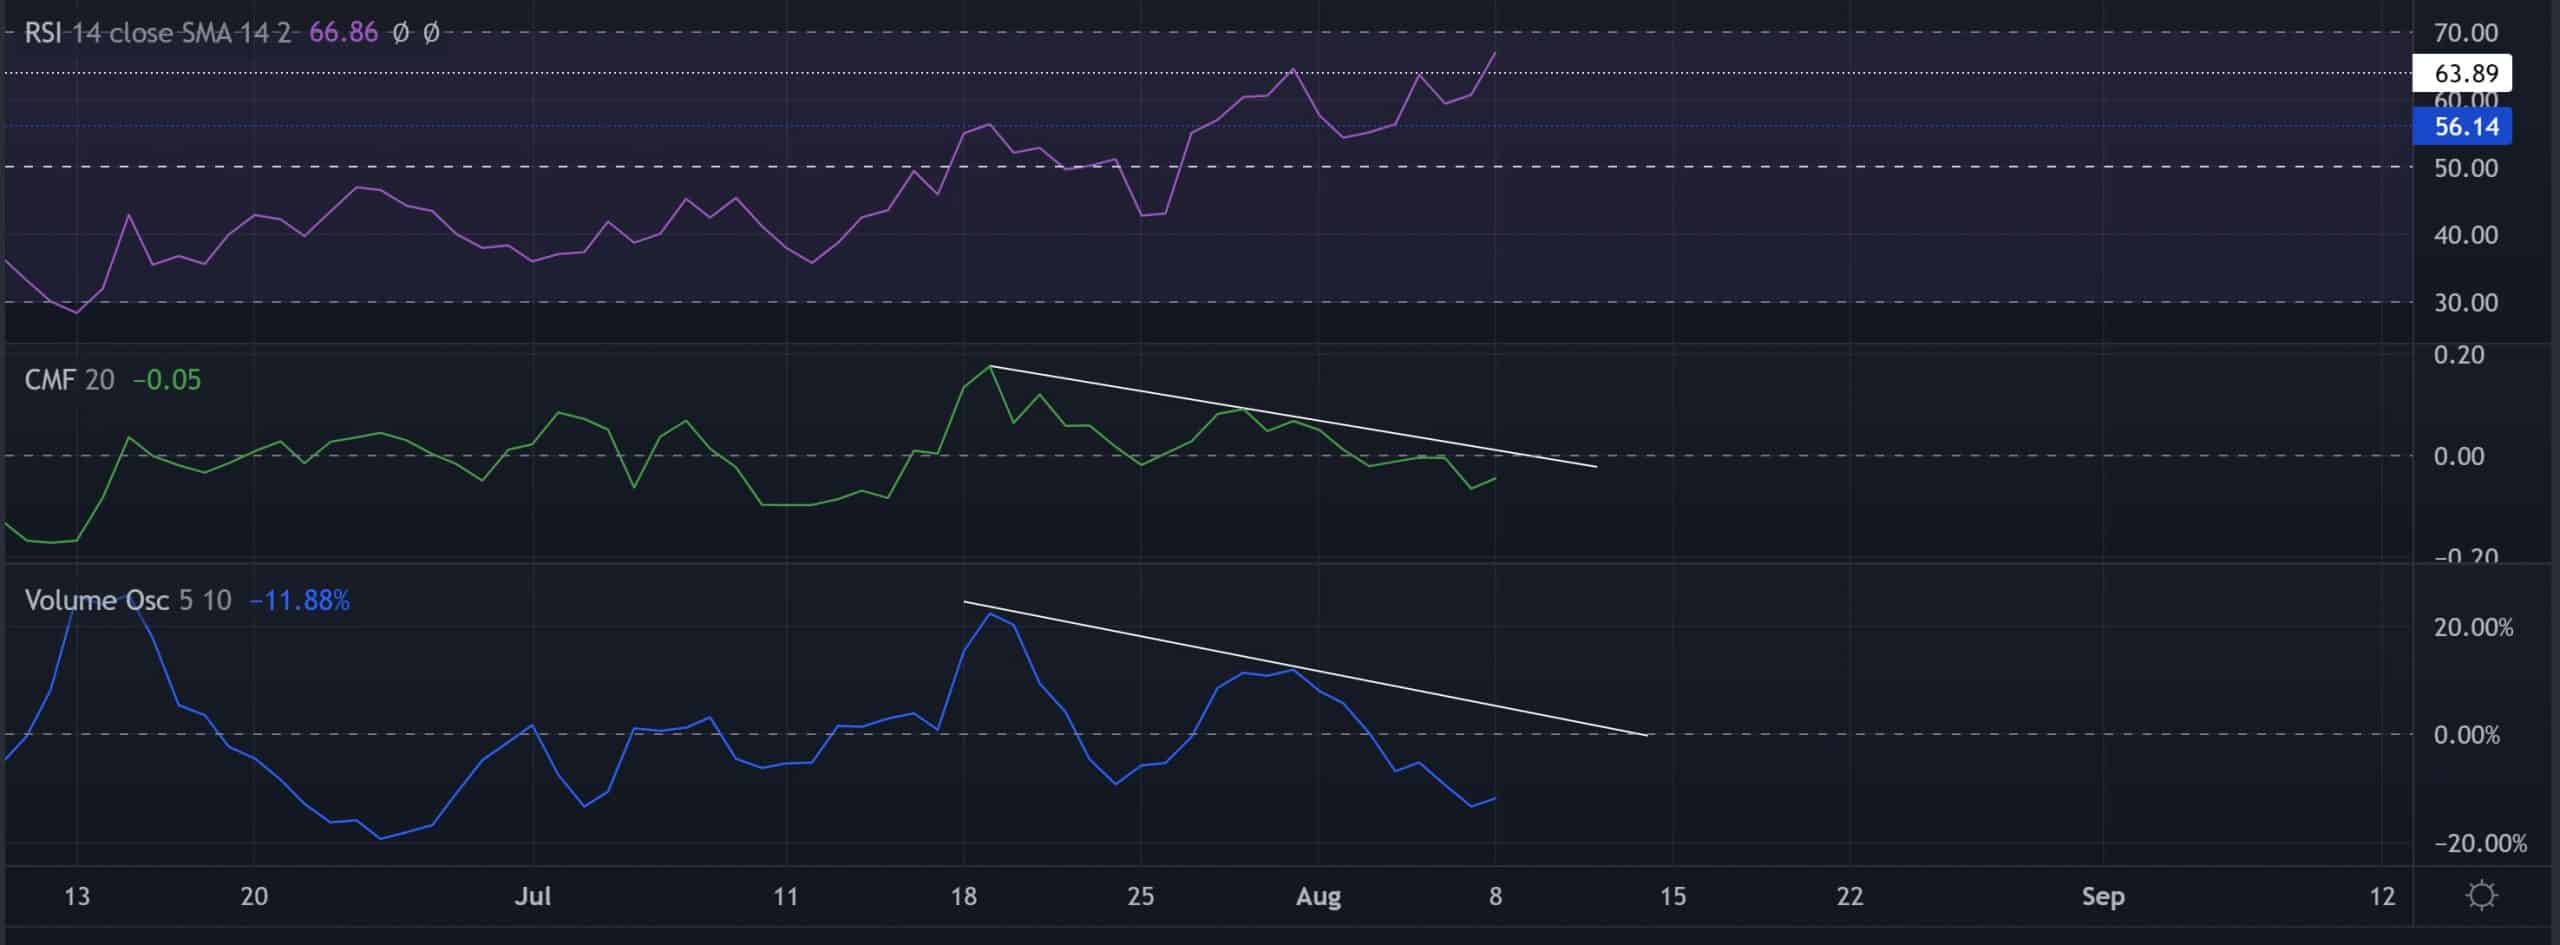
The Relative Strength Index (RSI) saw a breach of the 63-mark while the bulls exerted consistent pressure. Traders could look for a close below this level as a potential trigger for a near-term downside.
However, the Chaikin Money Flow (CMF) saw lower peaks while the price action marked higher highs. So, any rebound from its immediate resistance could affirm a bearish divergence. Similarly, the Volume Oscillator resonated with the CMF and reiterated the possibility of a bearish divergence.
Conclusion
Given the overbought readings on the BB alongside the rising wedge setup, DOT could see a near-term setback before picking itself up again. The targets would remain the same as discussed above.
However, an overall market sentiment analysis becomes vital to complement the technical factors to make a profitable move.