Polkadot, VeChain, Solana Price Analysis: 20 May

After dropping to a record low level, Bitcoin enthusiasts have been buying the dip. However, this correction seems like a large one and was a much-awaited correction. With BTC recovering from $32k to $40k, the altcoins in the market have also been noting a strong recovery on the charts.
Polkadot [DOT], VeChain [VET], and Solana [SOL] were among the cryptocurrencies that were holding strong and moving higher.
Polkadot [DOT]
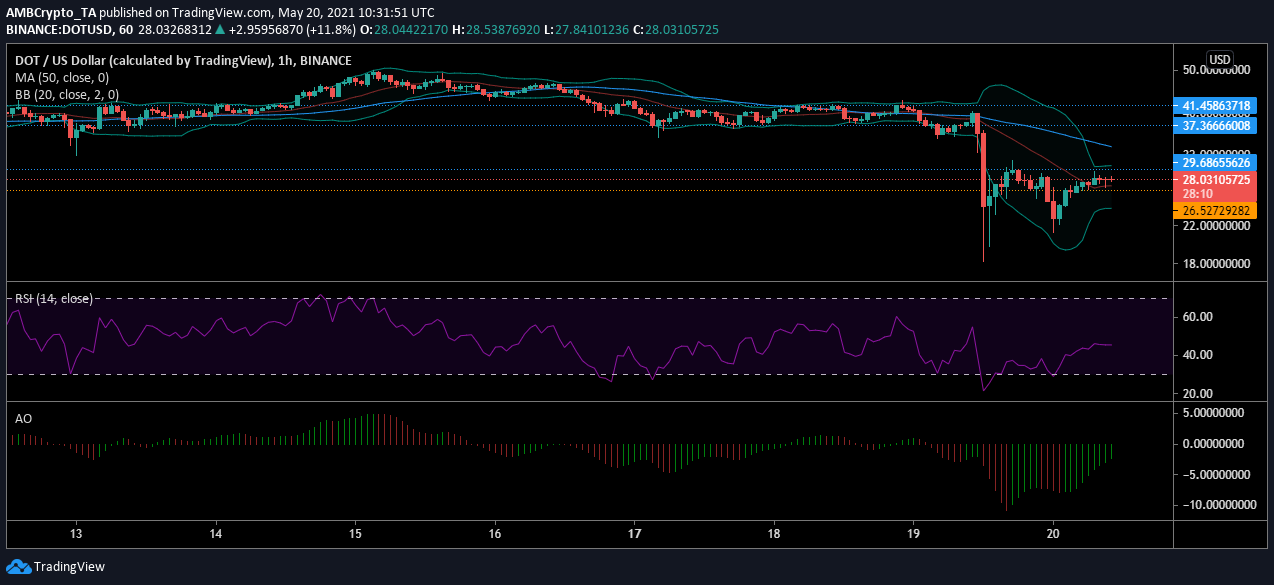
The strong dump in the Polkadot market pushed its price from $40 to $18. However, this drop was only momentary and the crypto bounced back above $26. At the time of writing, DOT was trading at $28.26. The token was moving within a restricted range of $26.52 and $29.68, while volatility exited the market.
The Bollinger Bands saw the inflated period of volatility converge to indicate the reduced movement of the token. The Signal line dropped under the candlesticks, a development suggesting that the price was moving at a higher level, even within the current range. Meanwhile, the buying pressure was rising as the Relative Strength Index was pushed to 47 from 30. This implied that even though DOT was oversold during the dump, traders saw this as an opportunity to buy the dip.
Finally, the Awesome Oscillator suggested that momentum was on the rise and could help the price hold on to its value.
VeChain [VET]
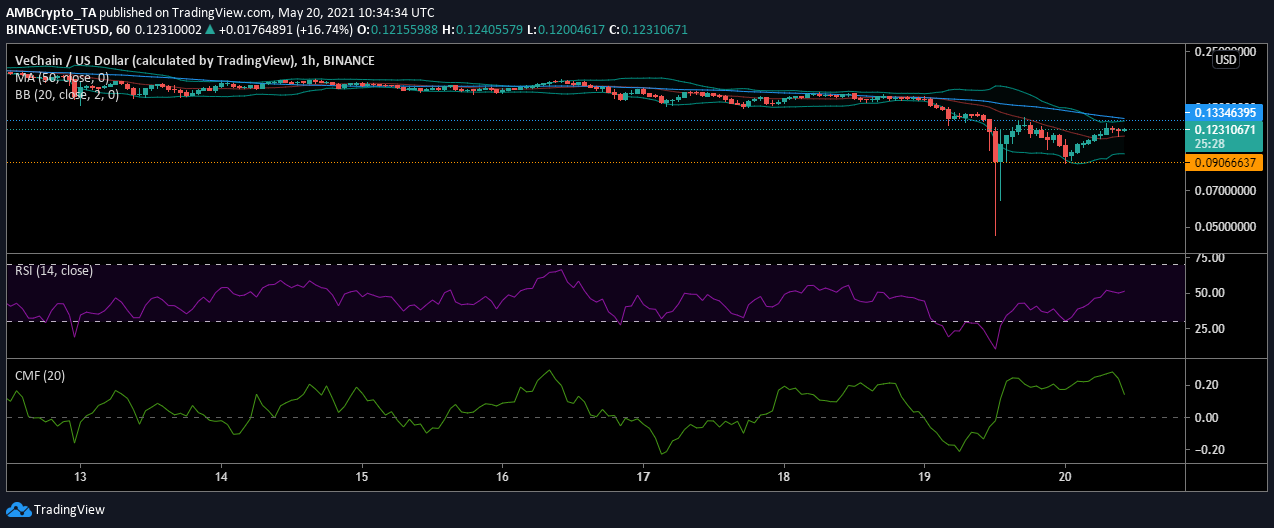
VeChain’s price broke down after a long time. It had held on to the support at $0.14, however, it dropped to as low as $0.0463. As the market went into recovery mode, VET’s price bounced back above $0.0906 as it established soft support. The digital asset was trading at $0.1257, at press time, and could test resistance at $0.1334.
The volatility remained low, at the time of press, as the Bollinger Bands converged. This recovery pushed the price on an upwards trend and the Signal line moved under the candlesticks suggesting a bullish movement. Rising buying pressure also helped the price move higher.
The Relative Strength Index suggested that after dropping well under the oversold zone, VET had returned to above this zone. With buyers showing interest in buying the asset, the RSI value had shot to 51. This was a sign of a stable market, while the money also remained within the market.
Solana [SOL]
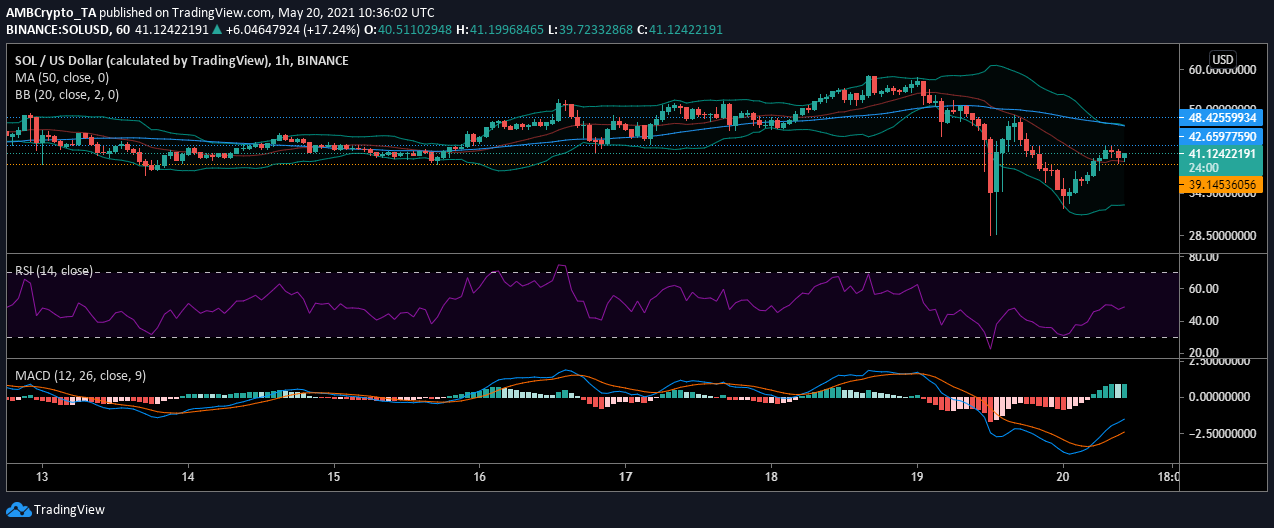
Solana’s price recently tested the resistance at $42.65, but failed to surpass it. At the time of press, SOL was trading at $42.28 and trying to push past its resistance. The bullishness in the market might help the digital asset to move past this point.
The Bollinger Bands suggested that volatility was significant in the SOL market. As the price dropped the second time after testing the resistance, it formed a support level at $39.14. As the price consolidated at this level, the Signal line dropped under the candlesticks and marked an upwards trend for the SOL token. Meanwhile, the buyers have been dominating the market as the Relative Strength Index hit 52, which was a little above the equilibrium level.
This bullish momentum clubbed with the MACD’s bullish signal pointed to SOL’s move above $42.65.


