Polygon [MATIC] traders can consider $0.86 as a buying opportunity and $0.92 as…

Disclaimer: The information presented does not constitute financial, investment, trading, or other types of advice and is solely the writer’s opinion.
The USDT Dominance metric stood at 6.63% at the time of writing. It has fallen from 7.33% just a couple of days back, a fall measuring 9.7%. The USDT Dominance shows how much of the crypto market cap USDT constitutes.
A fall in this number indicates USDT being exchanged for crypto assets. Over the past 48 hours, Bitcoin [BTC] has been able to climb from $18.6k to $21k, an ascent of 12%. Polygon [MATIC] has also posted gains over the same time period, and a buying opportunity could soon arise.
MATIC- 4-Hour Chart
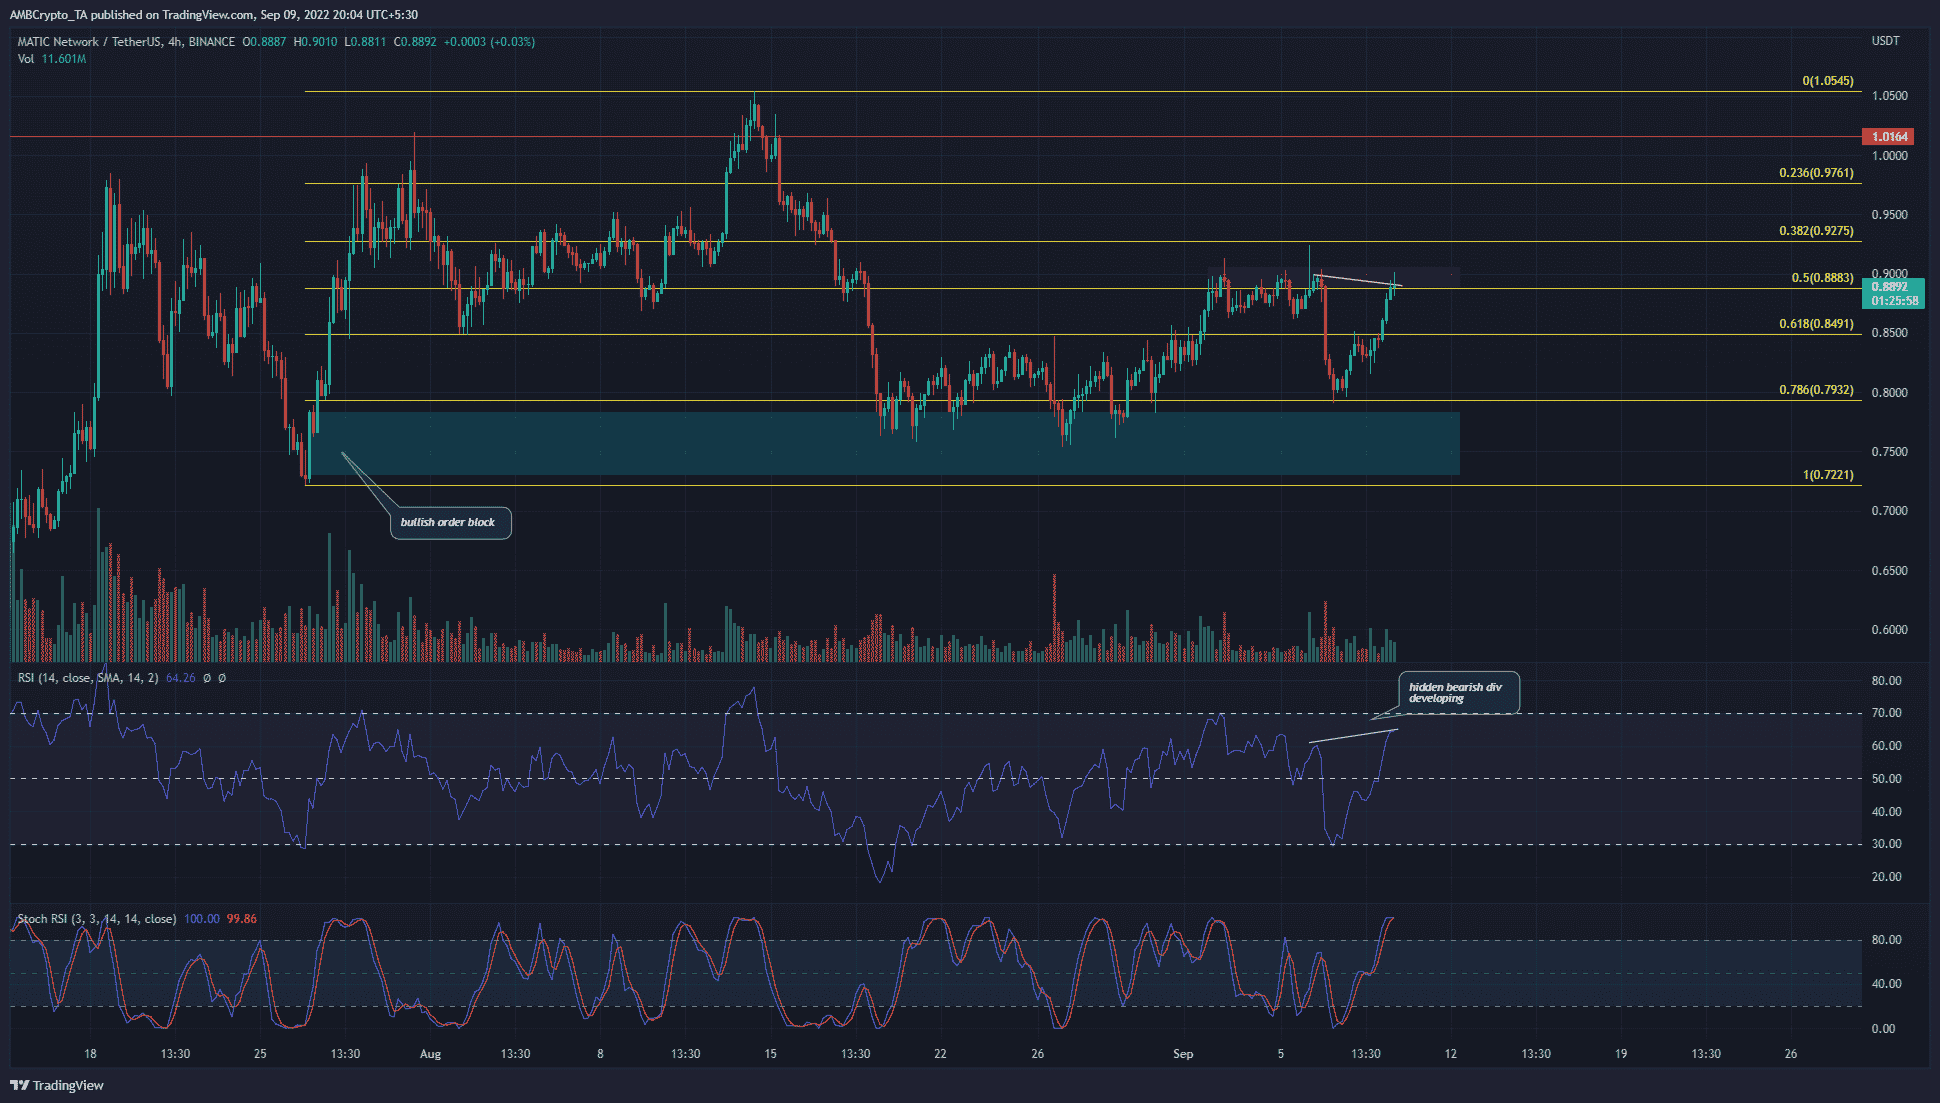
On the four-hour chart, the $0.9 area has been a stubborn resistance zone. A long upper candlewick to $0.927 earlier this week was not a pretty sight for the bulls either. It showed that the price tried to push to $0.9275 but was rebuffed.
A set of Fibonacci retracement levels (yellow) were plotted for MATIC based on the move from $0.722 to $1.05. It showed the 50% retracement level to lie at $0.888. Just above this level lay a band of resistance that has held for a week now. The Relative Strength Index (RSI) formed a hidden bearish divergence. This meant that a minor pullback can be expected.
To the south, the cyan box at $0.75 highlighted a bullish order block. Any pullbacks beneath $0.849 can still expect to find support there.
MATIC- 1-Hour Chart
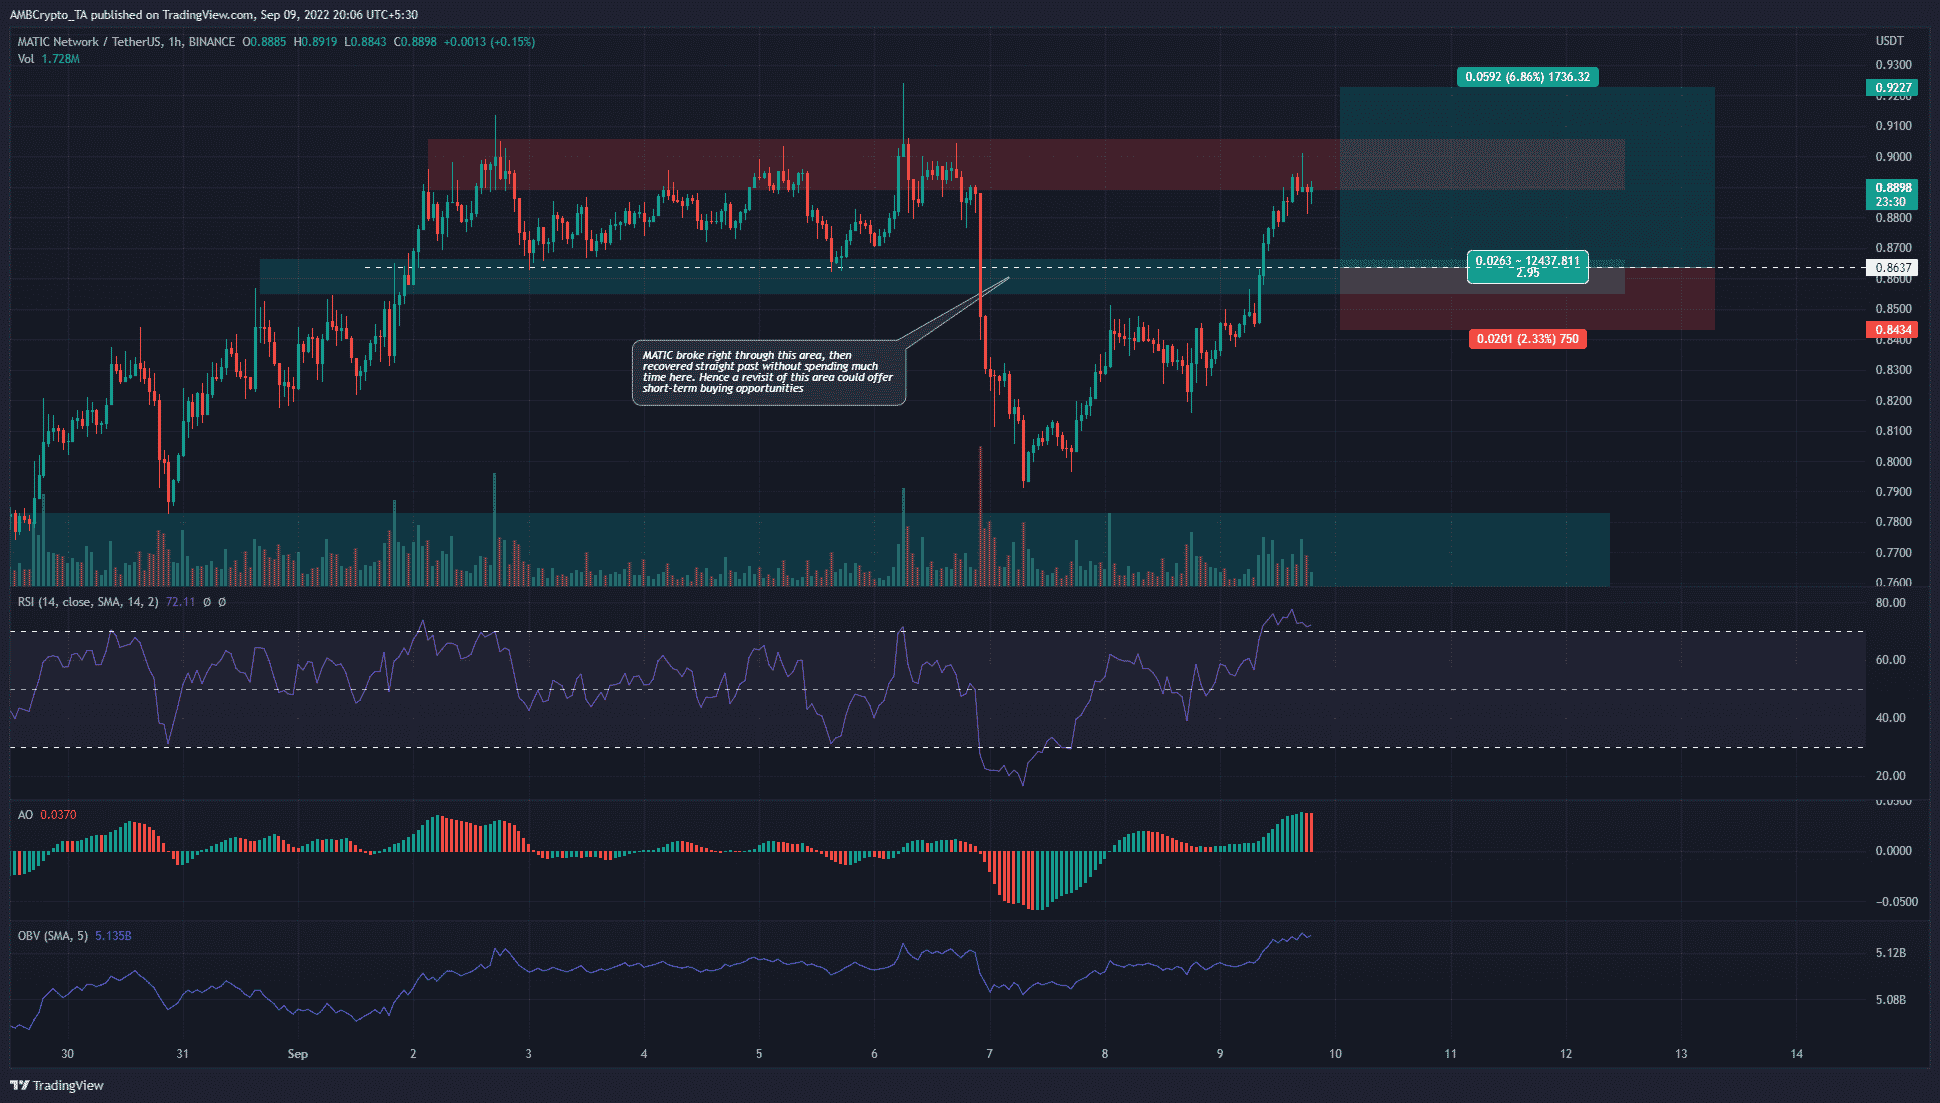
A lower timeframe chart showed that the $0.86 area represented an area of liquidity that the price could soon test. The 4-hour chart showed a minor pullback was likely. The indicators were strongly bullish on the one-hour timeframe, although the RSI was in overbought territory.
By itself, it does not show a pullback was imminent. The On-Balance Volume (OBV) has made some gains over the past couple of days, which showed demand was present behind MATIC.
The inefficiency at $0.86 could be tested and would likely offer a buying opportunity. A stop-loss can be set aggressively at $0.84, or lower at $0.814.
Conclusion
Bitcoin was bullish as it climbed past $20.8k, and further gains could appear over the weekend. Polygon’s native token could follow suit. A pullback to $0.86 would likely be a good opportunity to buy the asset. Ambitious traders can look to take profit at the $0.92 high from earlier this week.