Post Bitcoin’s latest ‘culling’, here’s what should precede a move to $42,000

Bitcoin’s price needs to cut off the weight to move higher on the charts. The latest crash on 20 February did just that. Therefore, market participants can expect bulls to take control, at least in the short term, resulting in an uptrend.
Technicals and on-chain metrics align
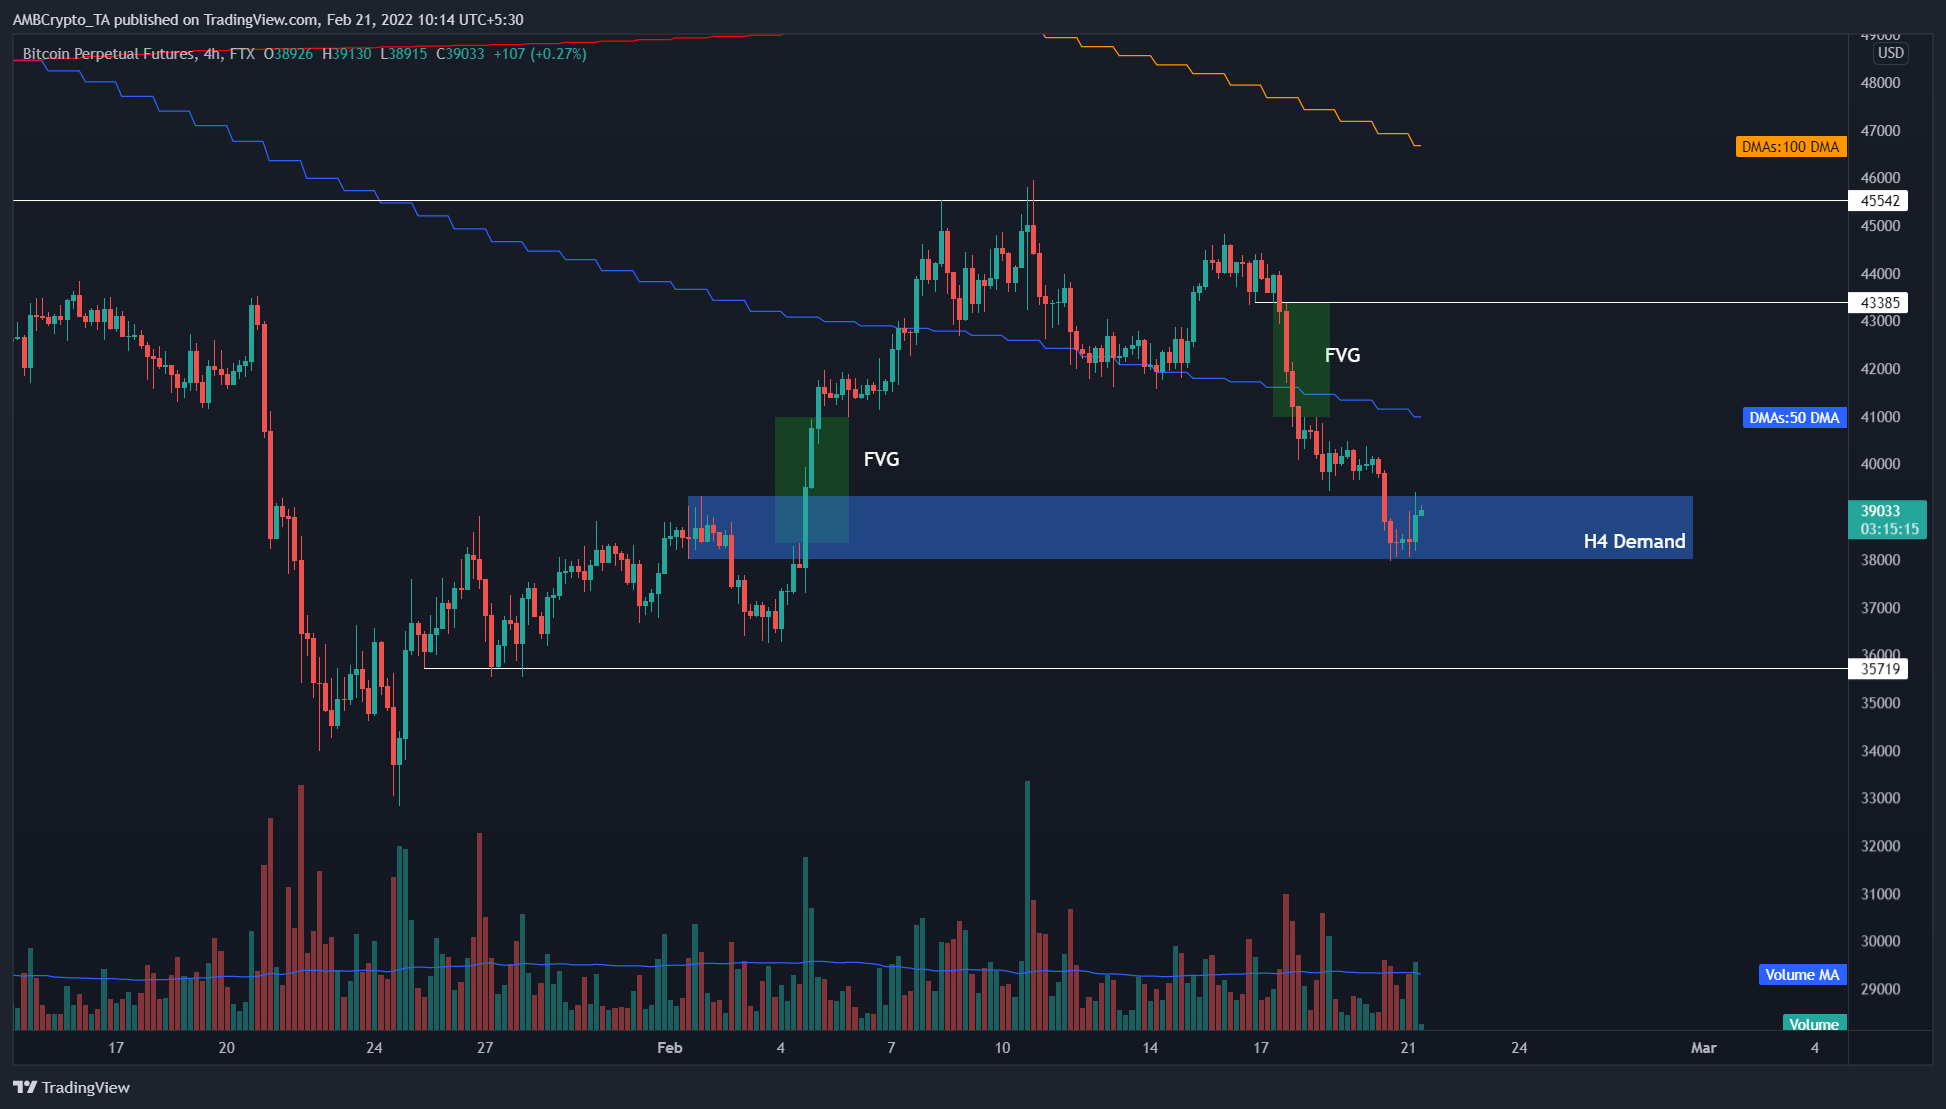
Bitcoin’s price dropped by 5.4% on 20 February, piercing a critical support area that could be the key to triggering a bullish outlook. This move served two primary purposes – Filling the fair value gap created on 4 February and retesting the four-hour demand zone, ranging from $38,006 to $39,332.
The short-term future of BTC looks bullish due to this down move and is likely to kick-start an upswing to $43,385. While this target is from a conservative approach, the uptrend could extend to $45,542, pushing the total gains to 16%.
While technicals might seem overly bullish, on-chain metrics back up the claim. The volume and Open Interest indices play a pivotal role in showing why BTC might head higher. The Open Interest for BTC dropped from $2.37 billion to $2.07 billion over the last five days. This 12% decline is a sign that over-leveraged traders were blown away by the recent drop.
This purging allows BTC to head higher, especially when combined with the sudden uptick in BTC’s volume. The volume increased from $1.03B to $2.03B over the same period.
From a bigger picture POV, this inverse relationship between Open Interest and volume indicates the liquidation of short-term traders while long-term holders take advantage to accumulate.

The 365-day Market Value to Realized Value (MVRV) metric is significant in identifying the trend among holders. This on-chain index is used to determine the average profit/loss of investors who purchased BTC over the year.
A negative value suggests that short-term holders are selling at a loss. Interestingly, long-term investors tend to accumulate in these conditions, where the potential for sell-off is low or absent. Hence, any MVRV value below -10% is generally referred to as an opportunity zone.
For BTC, the 365-day MVRV is currently hovering around -19.5%. This is a sign of long-term investors accumulating.

Now, things are looking up for Bitcoin’s price. However, a potential spike in selling pressure, one that pushes BTC to produce a four-hour candlestick close below the demand zone’s lower limit at $38,006, will invalidate the bullish thesis.
This development could potentially trigger a crash of 6%, pushing BTC to retest the $35,719-support level.


