Predicting ADA’s potential to close above its 50-day moving average

Disclaimer: The findings of the following analysis are the sole opinions of the writer and should not be considered investment advice.
- Cardano broke down from its long-term descending triangle to reveal a solid bearish edge.
- The crypto network’s development activity has been consistently rising since April.
After plunging from the $1.2-resistance in April, Cardano [ADA] bears continued to find renewed pressure while the altcoin kept finding fresher lows. This descent entailed a trendline resistance (white, dashed) that induced selling rallies.
Here’s AMBCrypto’s price prediction for Cardano [ADA] for 2023-24
With the price action struggling to break the shackles of this trendline resistance, the sellers could induce a pulldown in the coming sessions. A close above this barrier could invalidate the bearish inclinations. At press time, ADA was trading at $0.3969.
ADA witnessed a reversal pattern on its daily chart
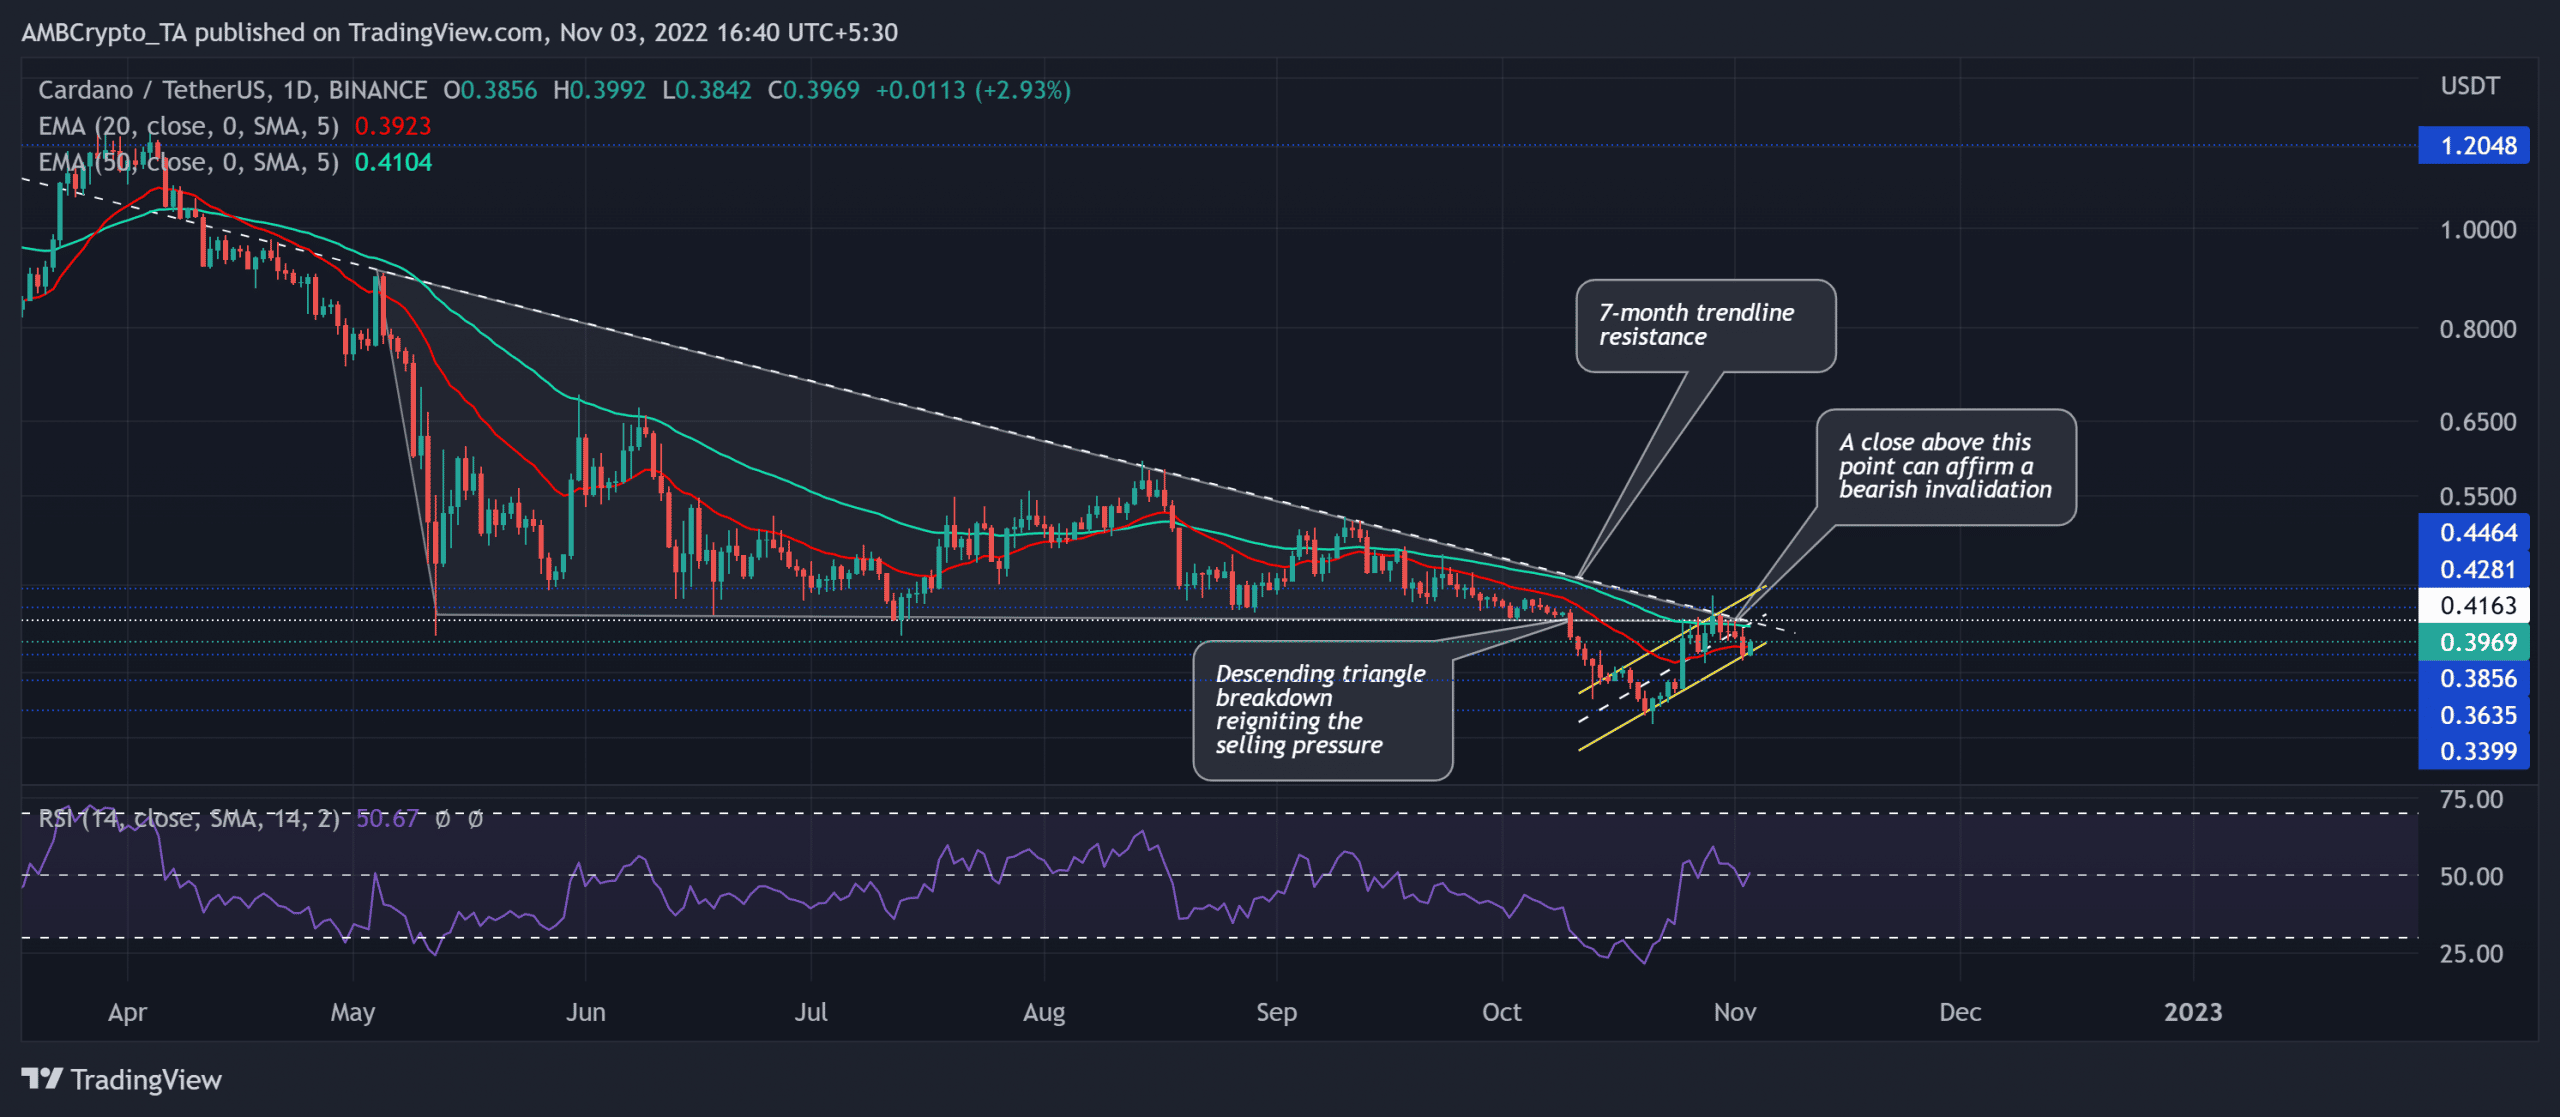
The descending triangle setup in the last few months depicted an increased selling advantage. The sellers kept lowering the peaks while the buyers strived to protect the $0.4163-mark.
The resultant breakdown resulted in the bears flipping this mark from support to immediate resistance. The entailing losses pulled ADA toward the $0.33 baseline before the buyers stepped in.
Then, ADA marked an up-channel recovery toward the $0.41 ceiling. The coin could see a reversal from this barrier and could confirm a bearish edge. Thus, a close below the $0.38-support could trigger a selling signal.
In this case, the buyers would look to re-enter the market in the $0.33-$0.35 range. Any growth above the trendline resistance in the $0.41-zone can confirm a bearish invalidation.
At the time of writing, the Relative Strength Index (RSI) strived to break above the equilibrium. The buyers keep an eye on the index to gauge ADA’s potential to maintain its spot above the 50-mark.
A spike in development activity
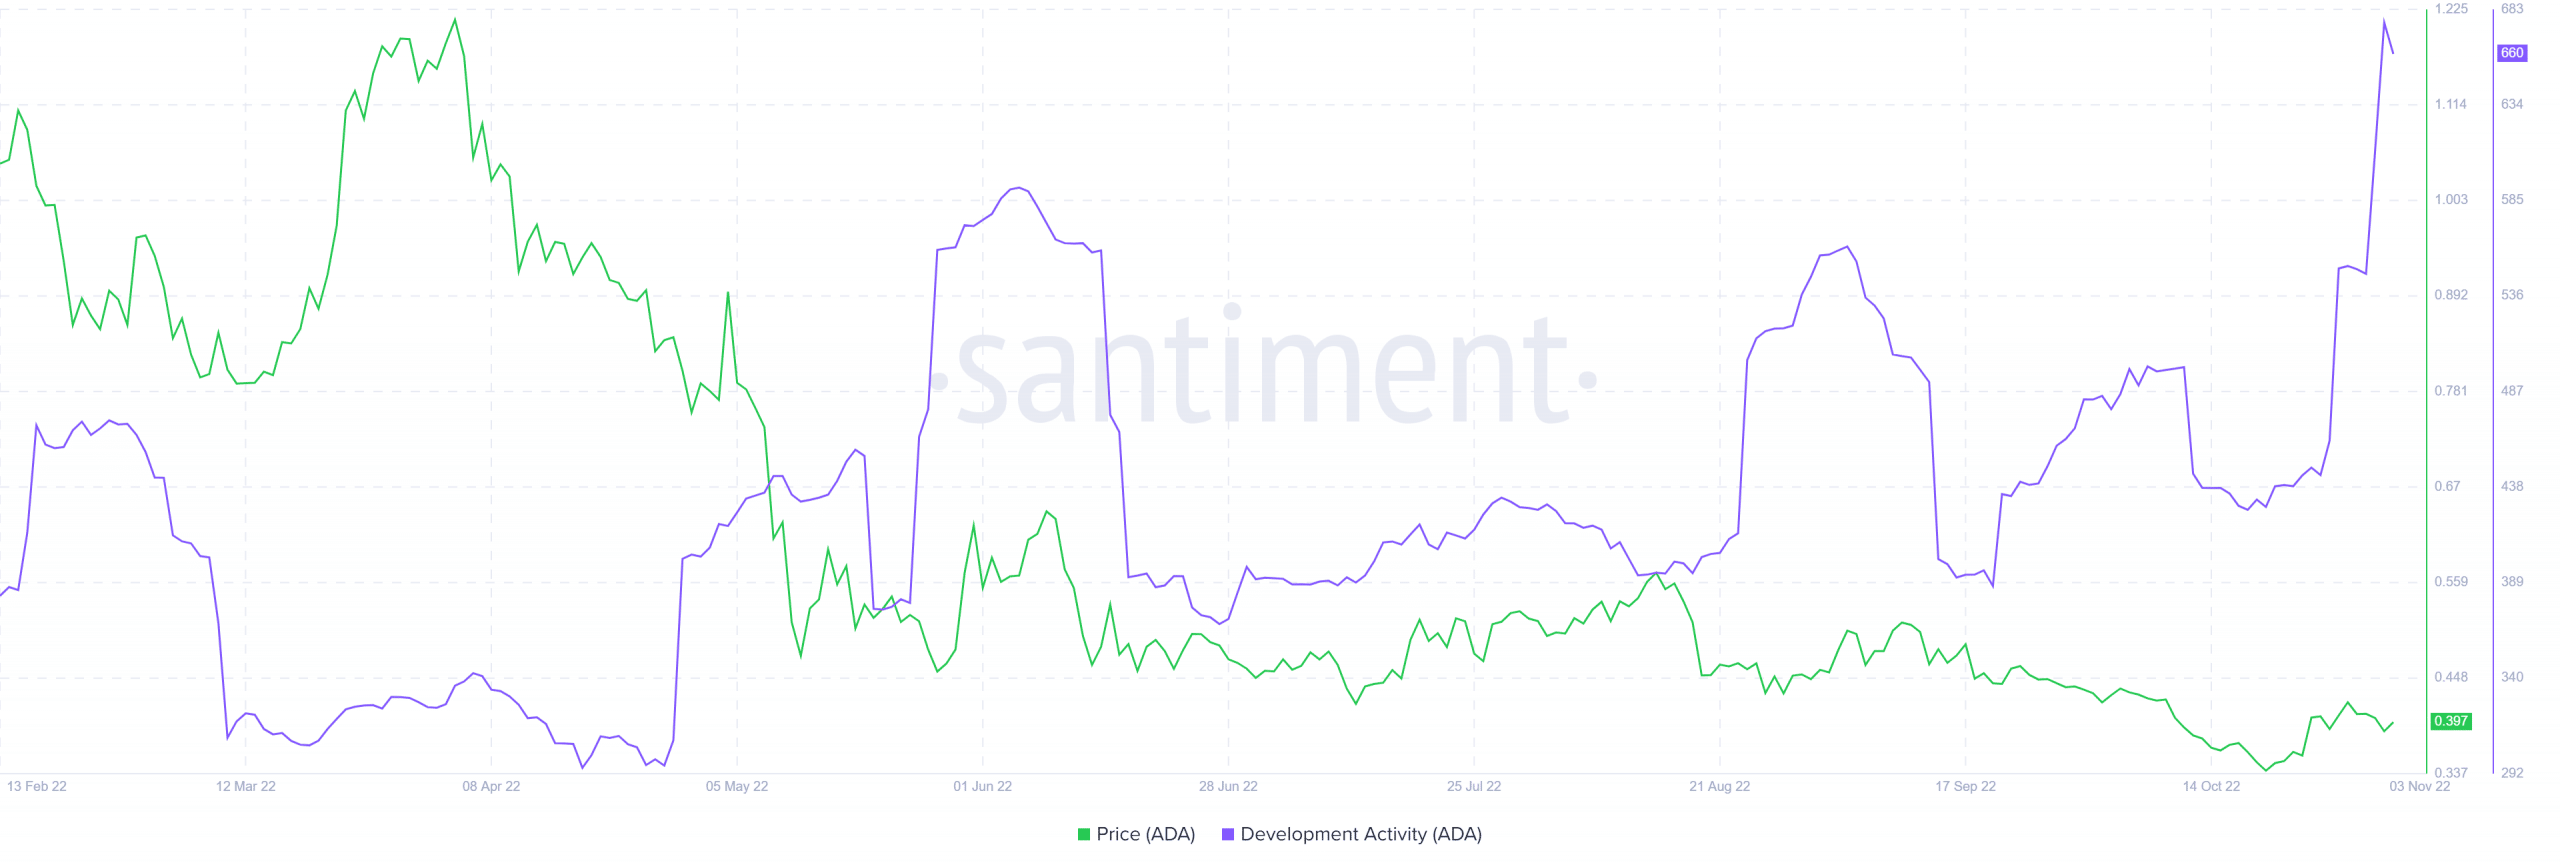
Interestingly, the price action’s decline phase since April this year marked a consistent growth in ADA’s development activity. This reading entailed the blockchain’s intentions to deploy new features and possibly improve its network growth in the coming times.
Any improvement in the broader sentiment can invalidate the bearish inclinations in the coming weeks.
Finally, the buyers should factor in Bitcoin’s movement and its effects on the wider market to make a profitable move.