Quant [QNT] hit a neutral position, but the bears can benefit at these levels
![Quant [QNT)] hit a neutral position, but the bears can benefit at these levels](https://ambcrypto.com/wp-content/uploads/2022/12/mike-enerio-FkD-bmfMgtw-unsplash-e1672303302445.jpg)
- QNT was in a neutral market structure on the 4-hour chart.
- It could drop below the current near-term support at $110.0 or go lower.
- A move beyond $112.0 will invalidate the above bias.
Quant (QNT) rallied from $104.9 to $118.2 between Christmas Day and 27 December, gaining over 11%. However, a price correction threatened to wipe out almost half of the near-term gains.
At press time, QNT was trading at $109.8 but was still in a neutral market structure with no clear market direction. But it is worth noting that QNT broke below $114 after Bitcoin (BTC) lost hold of the $16.77K level. So investors’ should make BTC movement part of their watchlist.
Nevertheless, QNT could break this critical near-term support if buying pressure dropped further.
Read Quant (QNT) price prediction 2023-24
The support at $110: will it hold?
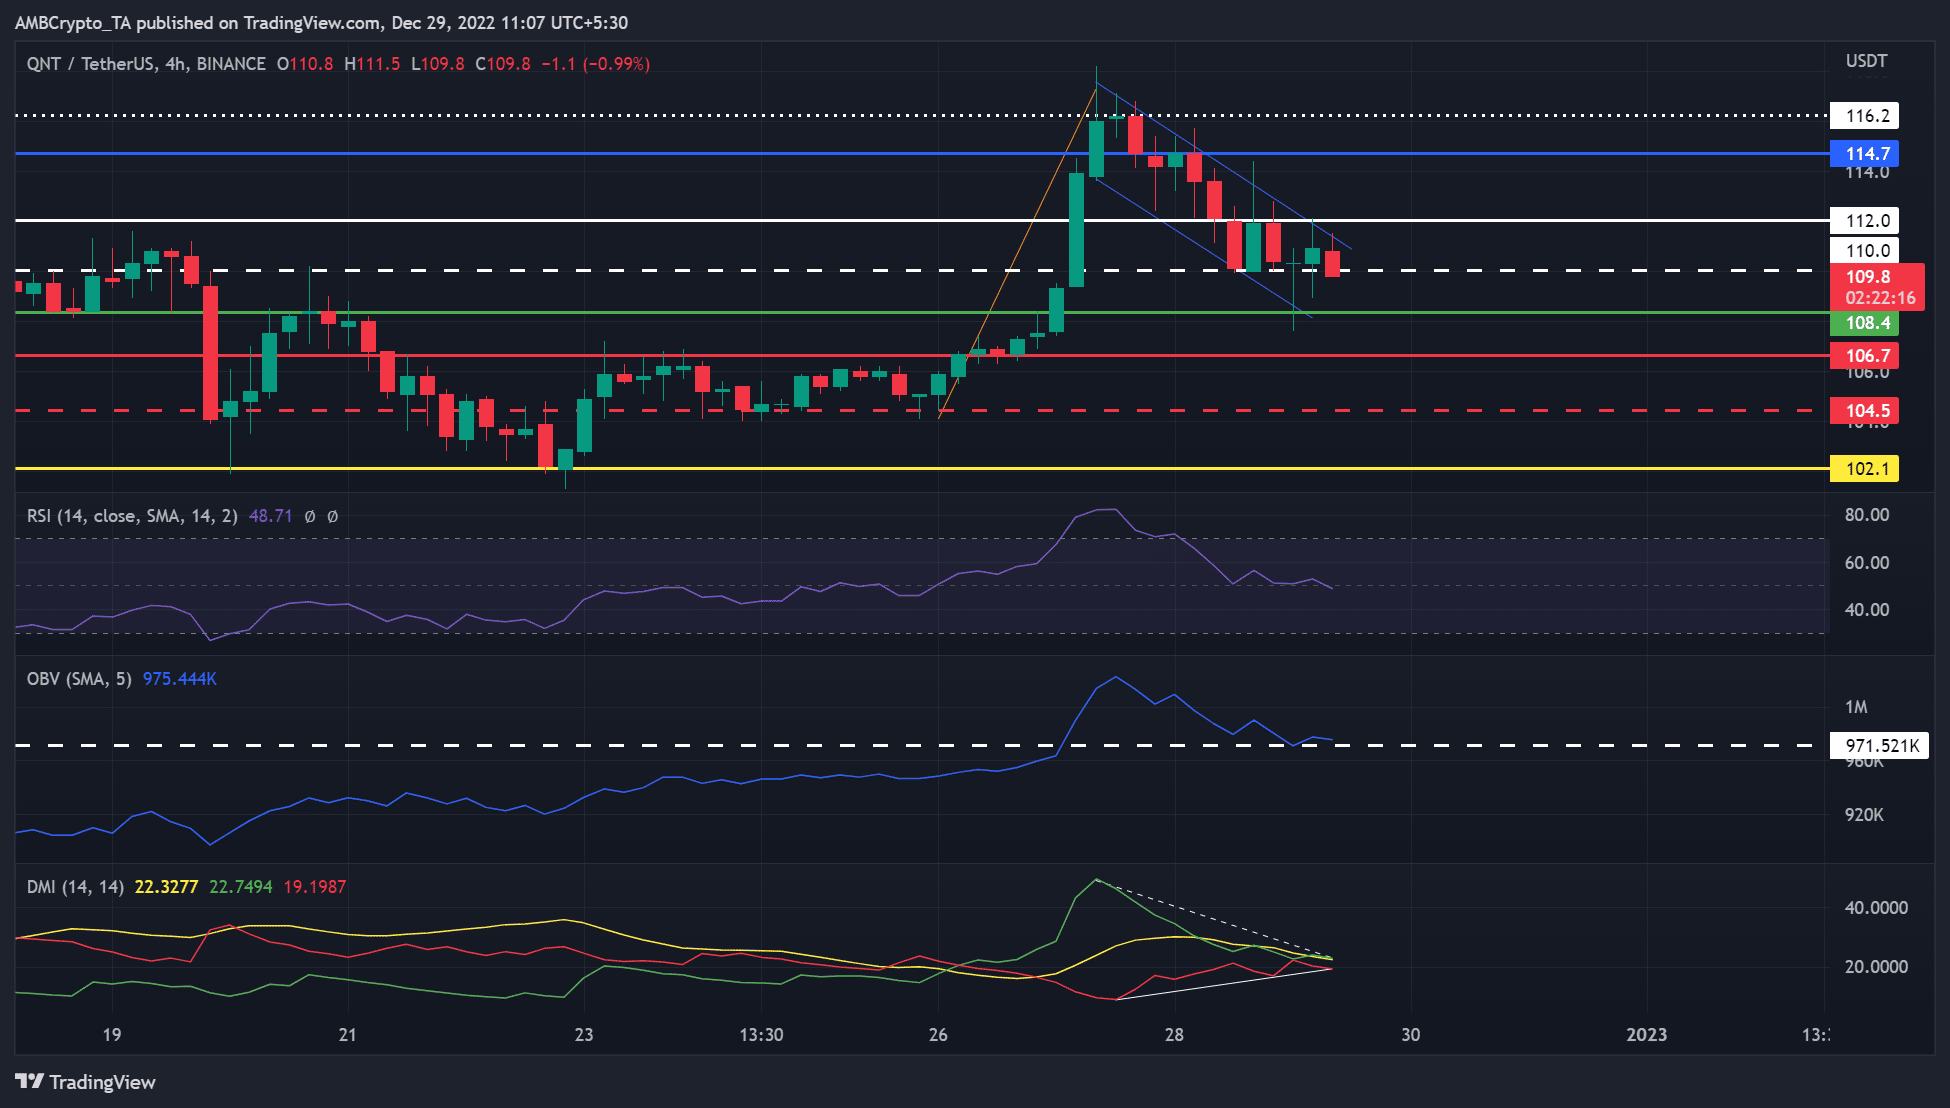
QNT’s recent price correction found steady support at $110.0. However, the support has been retested five times and could fail to hold if selling pressure increases.
The Relative Strength Index (RSI) had retreated from the overbought area and retested the midpoint without a strong bounce back. This showed buying pressure had dropped steadily, and bulls faced the challenge of a trend reversal.
Accordingly, the Directional Movement Index (DMI) showed buyers had little leverage at 22.7 over sellers’ 19.2. But none had over 25 units, showing the market was neutral.
Nonetheless, selling pressure steadily increased as volume dropped, as indicated by the On Balance Volume (OBV).
Therefore, QNT could break below $110.0 or go lower if selling pressure increases. If it breaks below it, the levels at $108.4, $106.7, and $104.5 could serve as short-selling targets.
However, a break above $112.0 will invalidate the above bias and provide a signal to close the short positions. Such an upward move could lead to a patterned breakout from the flag pattern (blue lines) with a possible bullish target at $114.7.
How many Quant (QNT) can I get for $1?
QNT’s development activity flattened, and sentiment dropped
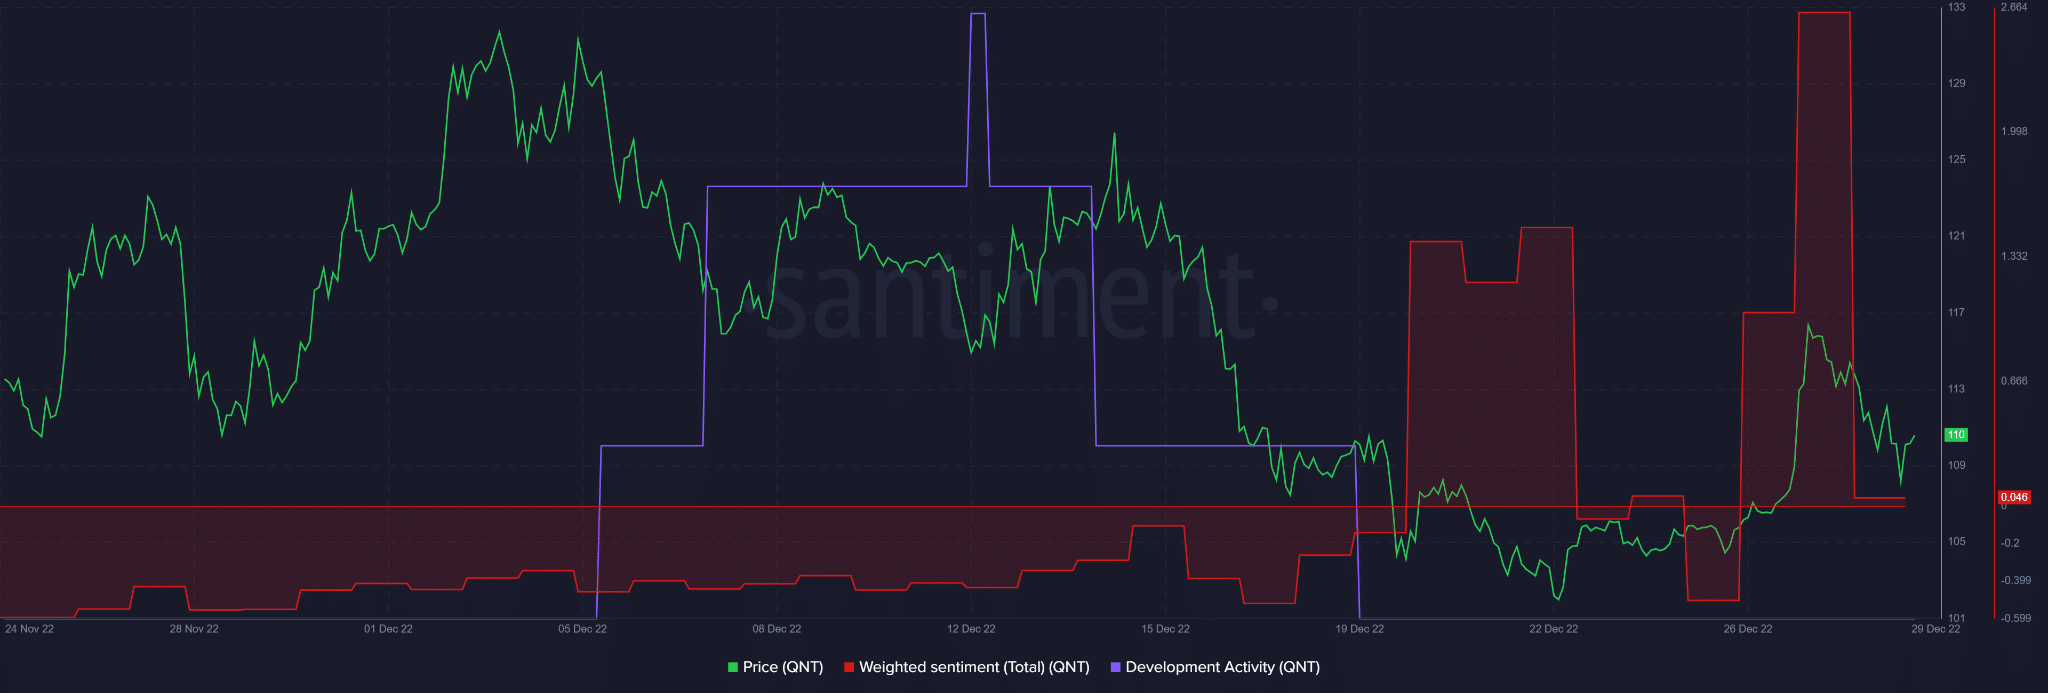
According to Santiment, QNT’s development activity has remained flat since 19 December. Nevertheless, a price increase around 26 December coincided with an elevated sentiment on the positive side.
At press time, sentiment had retreated to almost the neutral level, with development activity remaining flat. Could these conditions undermine bullish momentum?
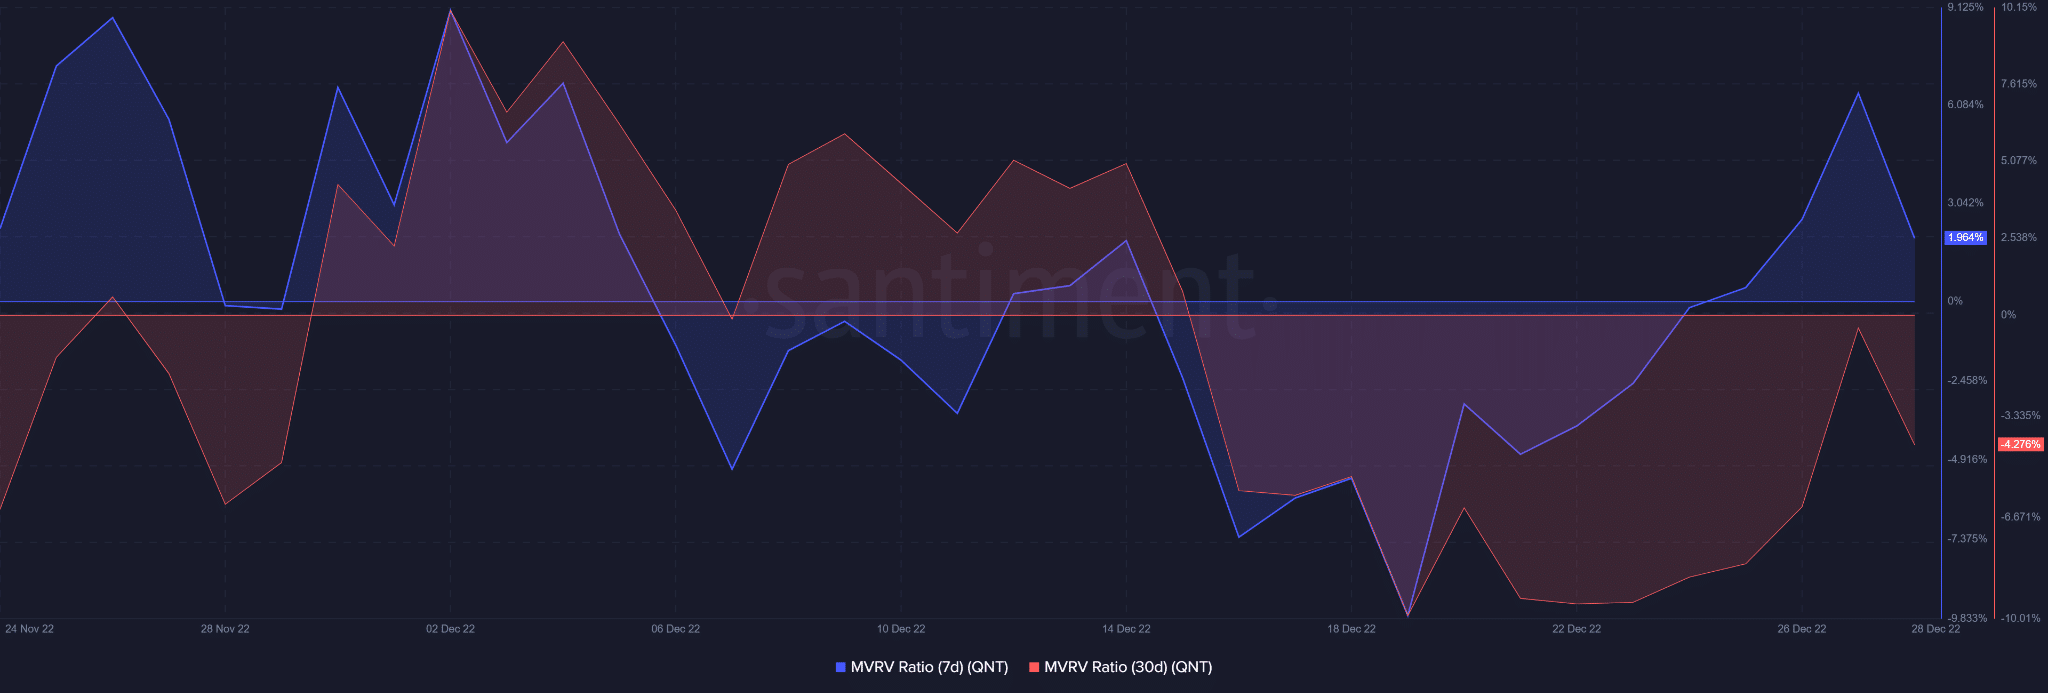
In addition, QNT holders that held the asset for a week saw profits, unlike those who held it for a month. According to Santiment, the 7-day MVRV recently climbed on the positive side while the 30-MVRV remained on the negative side.
Hence, short-term holders were affected differently by recent QNT’s price movement.