Reasons why XRP investors can shoot for the moon

Disclaimer: The findings of the following analysis are the sole opinions of the writer and should not be considered investment advice.
In particular, XRP noticed a gradual elevation that set a solid foundation for retesting the $0.37-$0.38 resistance range. Also, the 61.8% Fibonacci resistance in the $0.39 region stood sturdy to constrict the recent buying rallies.
But the altcoin was yet to find a volatile break away from the binds of the 20/50 EMA. A reliable rebound from the current pattern’s lower boundary can aid the buyers in retesting the immediate resistance range.
A close above or below the current pattern would likely influence XRP’s near-term movements. At press time, XRP traded at $0.3754.
XRP 4-hour Chart

Over the past month, the altcoin found rebounding grounds from the 16-month support near the $0.3-mark. This recovery entailed an over 35% growth toward the $0.4 region on 30 July.
The reversal from this region has found dependable grounds in the $0.367 level. As a result, XRP saw a two-week trendline resistance (white, dashed) alongside its incremental troughs.
The 200 EMA (green) has reflected its rebounding inclinations while the broader outlook favored the buyers.
But the traders/investors should watch out for a potential bearish crossover on the 20 EMA (red) and the 50 EMA (cyan) to confirm a near-term bearish bias.
In this case, XRP could eye to breach the bounds of its current up-channel. Here, the potential targets would lie near the 200 EMA in the $0.367 zone.
Nonetheless, the Point of Control (POC, red) could pave a path for the buyers to step in and retest the 61.8% level near the $0.39-mark.
An immediate recovery above the 38.2% hurdle would help the buyers retest the two-week trendline resistance.
Rationale
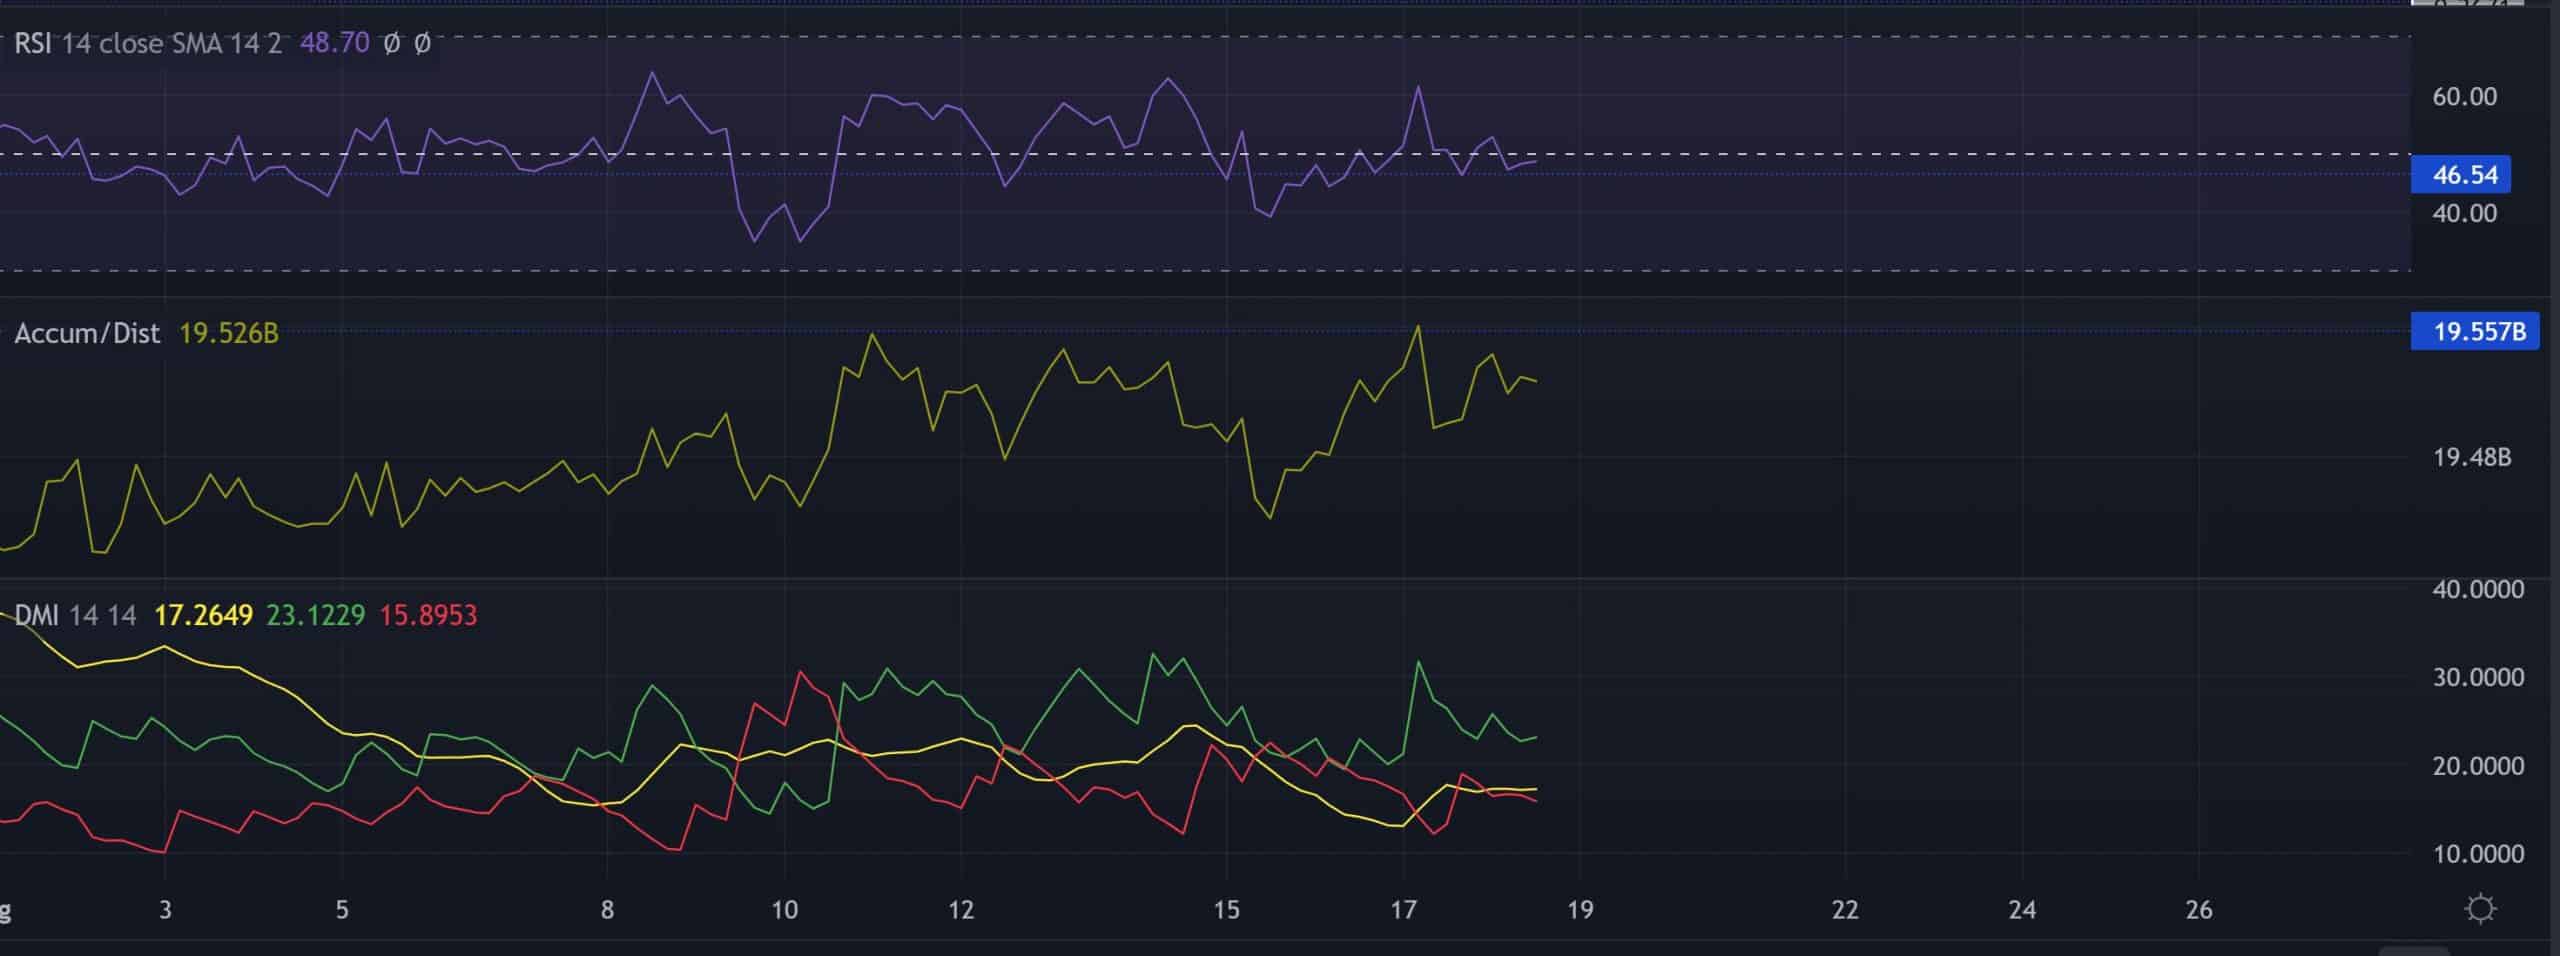
The Relative Strength Index (RSI) continued to exhibit neutrality after bouncing back from 46-support. An inability to considerably close above the equilibrium could fuel the near-term bearish inclinations.
The Accumulation/Distribution resonated with the recent buying pressure but plateaued in the 19.5- region.
Further, the Directional Movement Index (DMI) lines depicted a buying edge. But with the ADX revealing a weak directional trend, the buyers must boost the trading volumes to inflict a volatile break.
Conclusion
XRP’s current up-channel structure could play out in favor of bears if the buyers fail to step in near the POC.
The potential of bullish crossover on the 20/50 EMA would further heighten these chances.
The targets would remain the same as above. A close above the 38.2% level would hint at a potential bearish invalidation.
However, keeping an eye on Bitcoin’s movement and the broader sentiment would be essential to determine the chances of a bullish invalidation.


