RUNE investors can leverage the alt’s pattern’s break by taking this position

Disclaimer: The information presented does not constitute financial, investment, trading, or other types of advice and is solely the writer’s opinion.
RUNE saw a convincing reversal from the 23.6% Fibonacci level over the last day. The buyers were inclined to breach the boundary of the EMA ribbons. But the bears were yet to let go of their long-term edge.
Meanwhile, the friction between the buyers and sellers at the Point of Control (POC, red) could continue to exist while the market structure redefines. At press time, RUNE was trading at $2.576, down by 11.69% in the last 24 hours.
RUNE Daily Chart
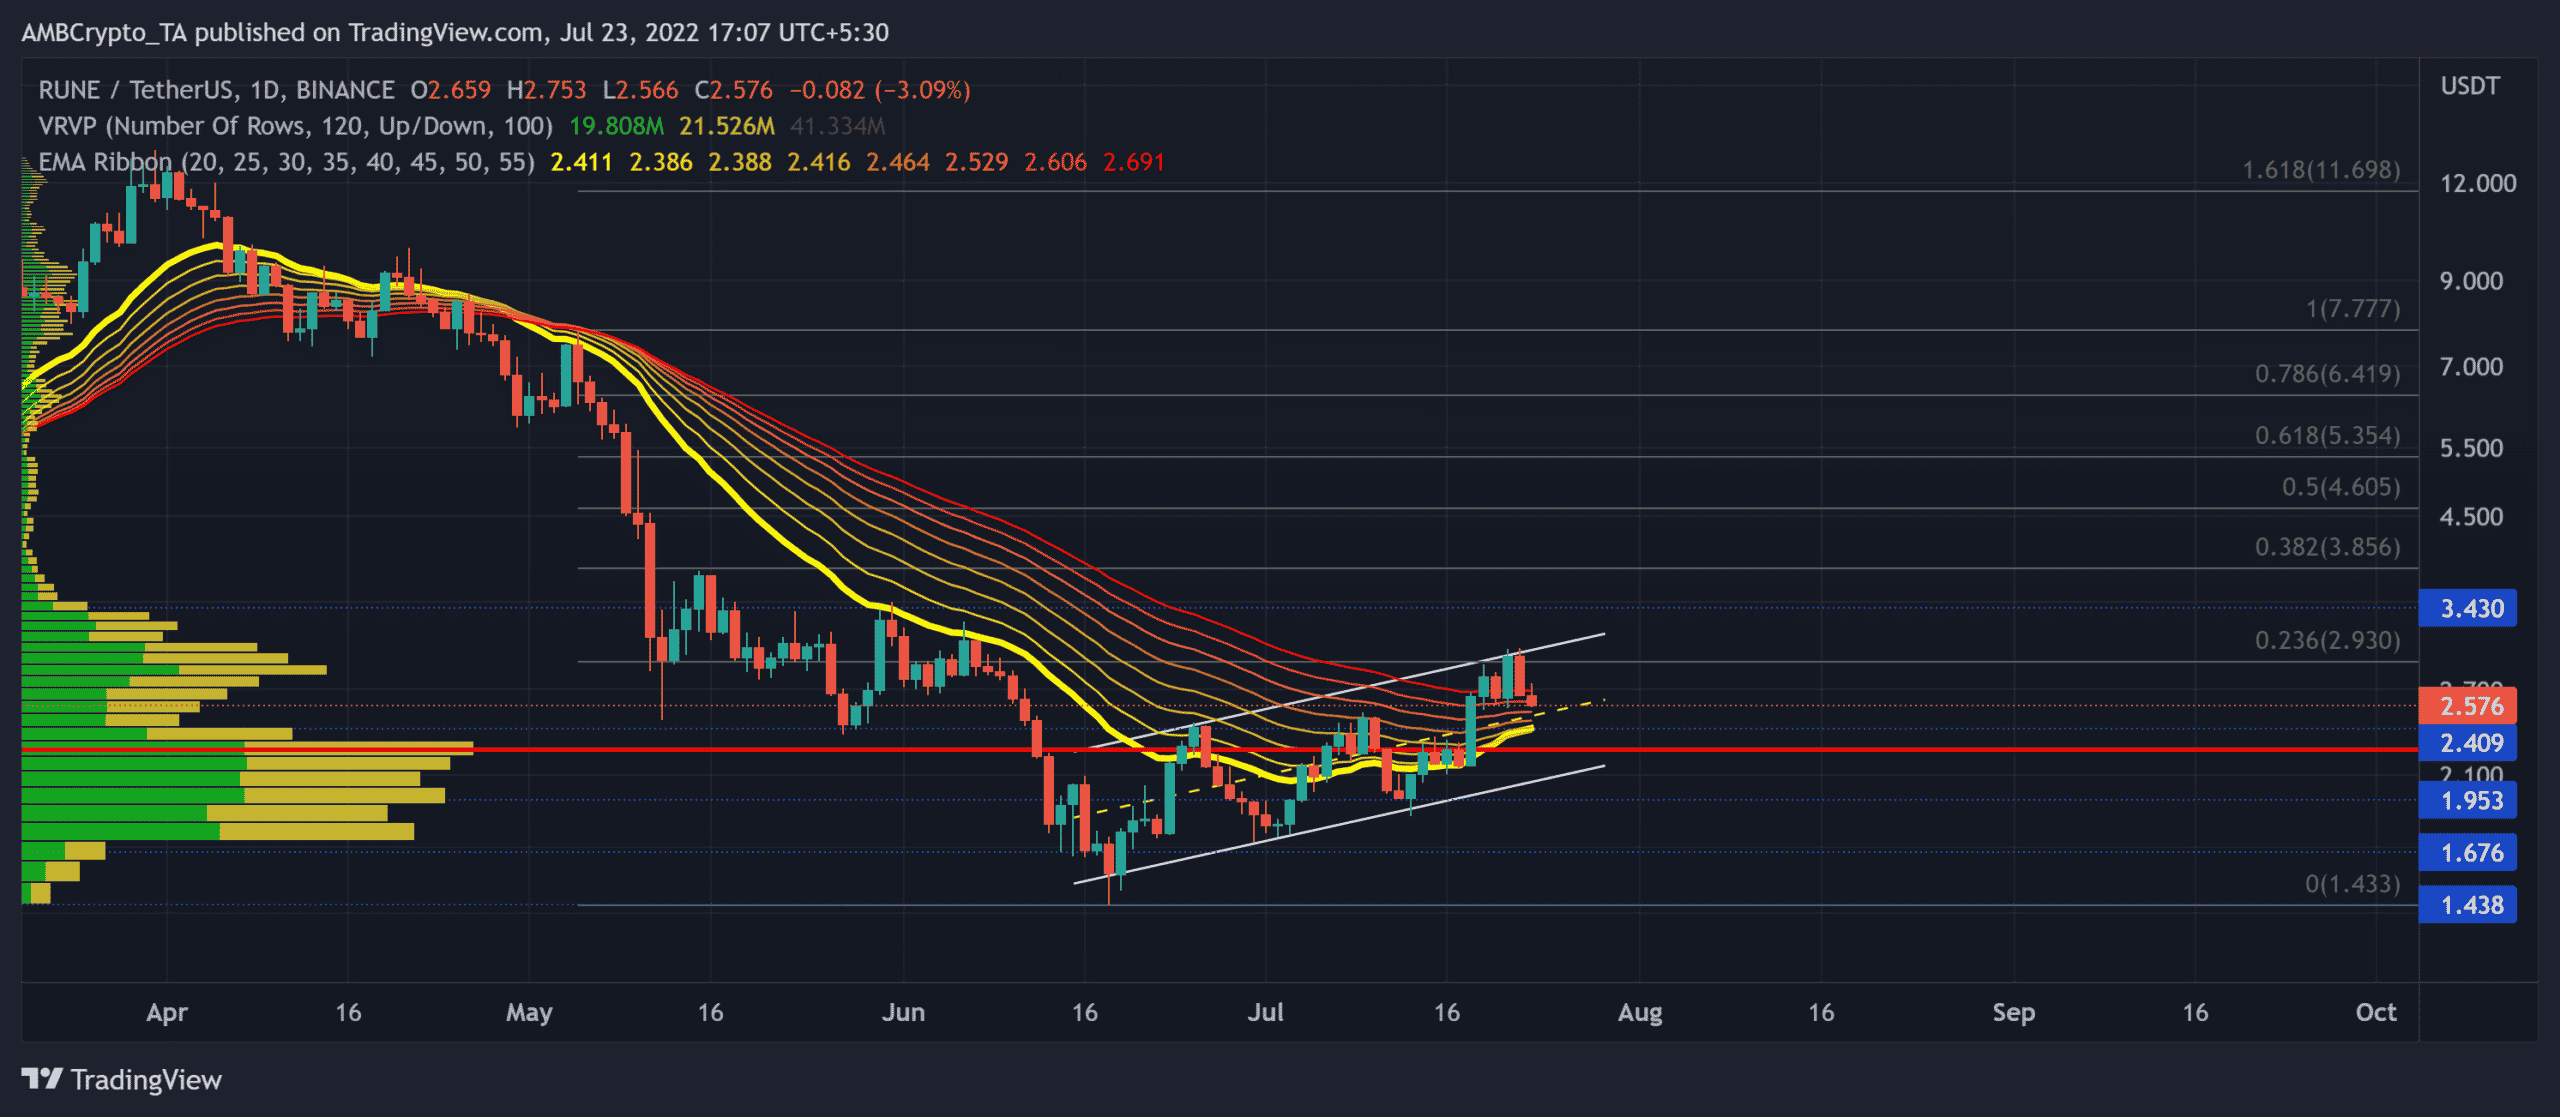
RUNE has been weakening on the chart since early April. After witnessing multiple strong rallies, sellers continued to find fresher lows over the last month.
RUNE lost nearly 90% of its value from (1 April) and plunged toward its 17-month low on 18 June. But the ongoing sell-off situation finally saw a cooldown near the $1.4-zone. As a result, the alt saw an up-channel (white) in the last few weeks.
This up-channel trajectory could now see a slowdown near the 23.6% Fibonacci level in the $2.9 zone. An inability of the buyers to inflict a bullish crossover on the EMA ribbons could further impede the revival endeavors.
Any close below the ribbons could extend the ongoing sluggish phase near the POC. Any break below the pattern could pull RUNE toward the $1.4-$1.6 range before a plausible recovery. Any bearish invalidations could see a ceiling near the $3.4-mark. However, the traders must wait for a close above the 23.6% level for this target.
Rationale
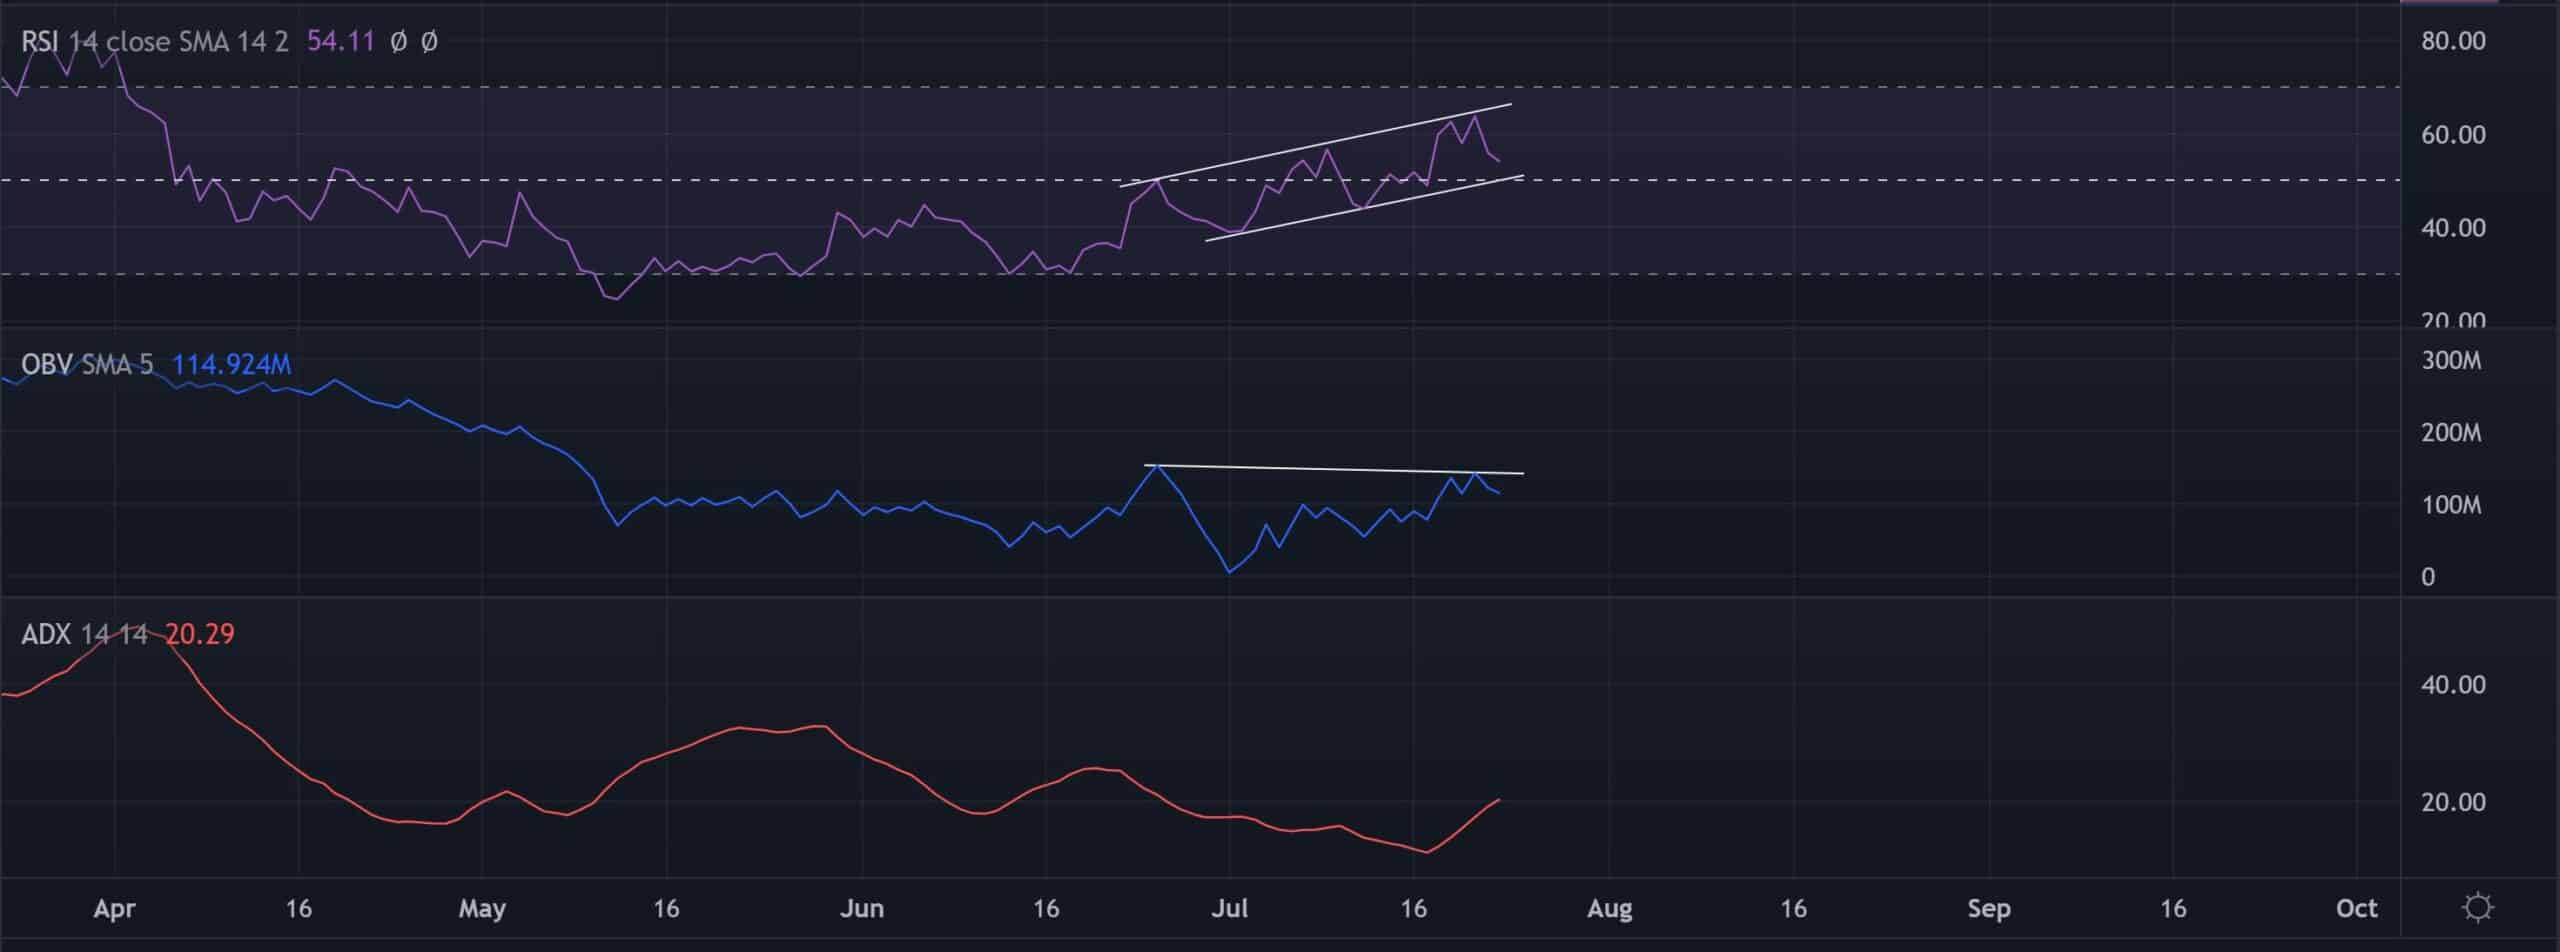
The Relative Strength Index (RSI) continued its sway in the bullish region whilst ensuring its up channel structure. Any reversal from this pattern could trigger a short-term setback on RUNE’s charts. This reading entailed that potential losses were possible before the bulls regained their upswing tendencies.
Furthermore, the On-Balance Volume (OBV)’s lower peaks in the last few weeks have reinforced the chances of a strong bearish divergence with the price. Despite the bullish edge, the sellers could play a spoilsport should the OBV continue its southbound journey. Nevertheless, the ADX depicted a weak directional trend for the alt.
Conclusion
In view of the immediate 23.6% level hurdle coupled with the ascending channel pattern, RUNE could see a pullback in the short term. Should the EMA ribbons undertake a bullish flip in the daily timeframe, the long-term tendencies could favor the bulls. The Targets would remain the same as discussed.
Finally, investors/traders must keep a close watch on Bitcoin’s movement affecting the overall perception of the market.

![Bittensor [TAO]](https://ambcrypto.com/wp-content/uploads/2026/07/Gladys-19-e1784100557377.jpg)