SAND after hitting its multi-monthly low could go funky if investors…

After the 20 EMA (red) refuted most of the recent recovery attempts, the sellers steered the trend in their favor by sinking the price below the lower trendline of the down-channel (yellow). This trajectory has impacted the buyer’s ability to negate the selling pressure whilst the alt poked its multi-month lows.
A possible recovery from this level could lead to a compression near the 23.6% Fibonacci resistance. Post which, the broader sentiment would have a strong say in letting the bulls test the 38.2% level. At press time, SAND traded at $1.39, down by 24% in the last 24 hours.
SAND Daily Chart

Since hitting its ATH last year, the bears have persistently marked lower peaks while the bulls failed to trigger a trend-modifying rally. This plunge visibly portrayed a superior bearish vigor, while the price action fell below the down-channel.
The latest buying rally on 1 May ceased at the 20 EMA. Consequently, SAND was down by nearly 57.6% in just the last six days. Resembling the market-wide crumble over the past day, SAND dropped to hit its eight-month low on 11 May.
With the price action constantly testing the boundaries of the lower band of its Bollinger Bands (BB), SAND’s price skewed toward the ‘cheaper’ side for quite a while now.
Thus, a possible revival in the coming days should not surprise the traders. The $1.5-zone is vital to confirm any possible rallies in the future. Should the current candlestick close with a shorter body, it could affirm a bullish hammer and heighten the chances of revival.
Rationale
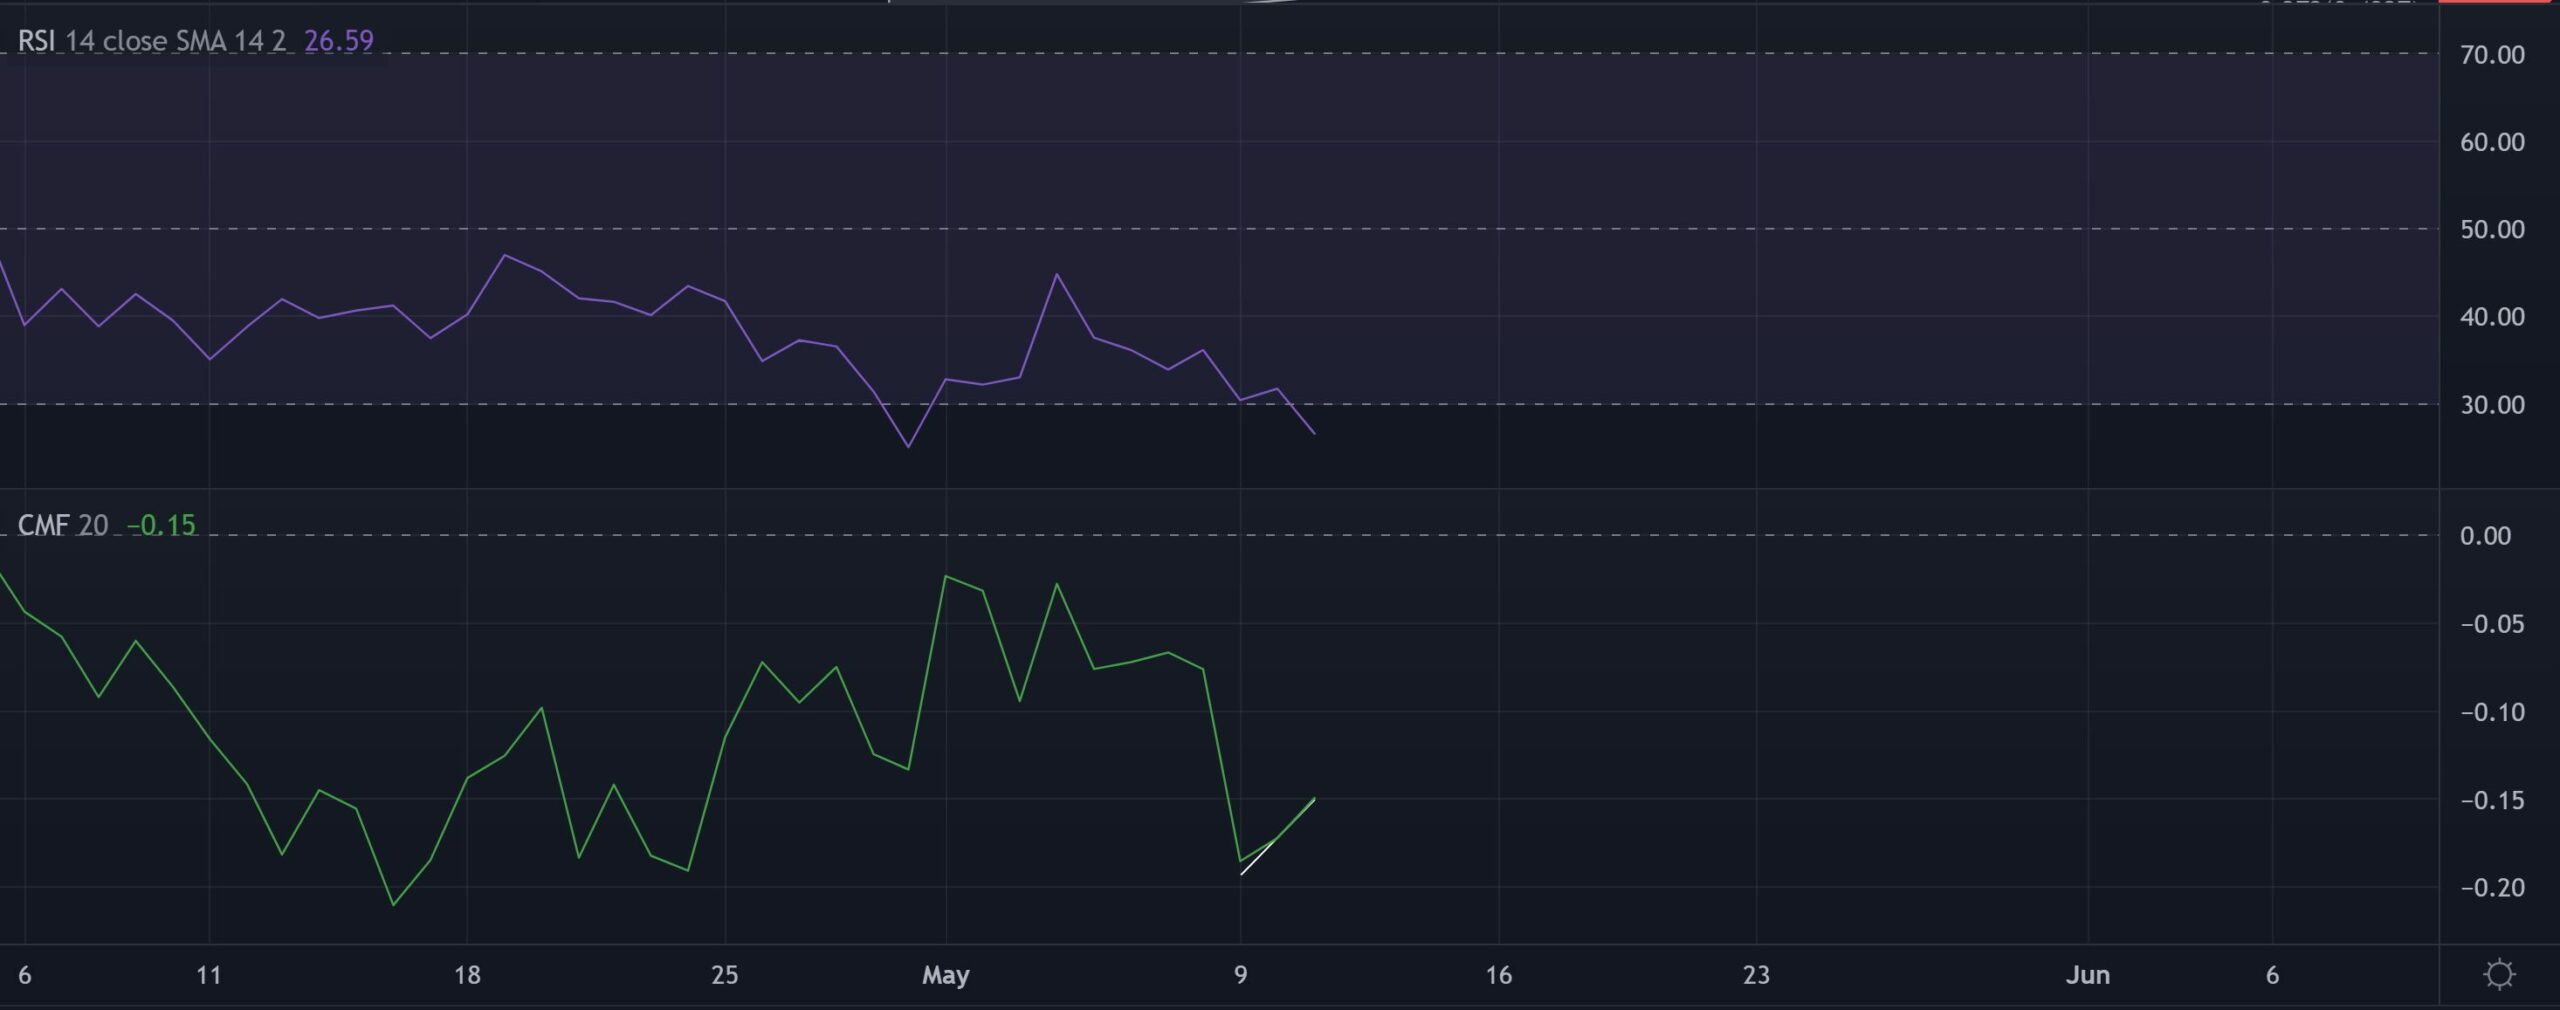
The Relative Strength Index suggested that the sellers had a visible advantage in the current scenario. Failing to find an area above the oversold mark, the buyers still had to push for more to propel the price to break its current bounds at the $1.5-level.
Further, the CMF revealed a bearish edge, but its recent movements have rather hinted at a bullish divergence with price.
Conclusion
While the market structure supported a bearish narrative, oversold readings on its BB and RSI alongside the bullish divergence with CMF kept some recovery hopes alive in the coming times.
Besides, the alt shares a staggering 92% 30-day correlation with the king coin. Hence, keeping an eye on Bitcoin’s movement would be vital to complement these technical factors.


