SAND recovers quickly from $2.8 lows, but can the rally push prices past $4.2

Popular metaverse token SAND dipped briefly before $3 but has recovered in the past week. Well, the interesting question here is- Could SAND token push toward $4.5? Or was the rally in late January only a relief rally?
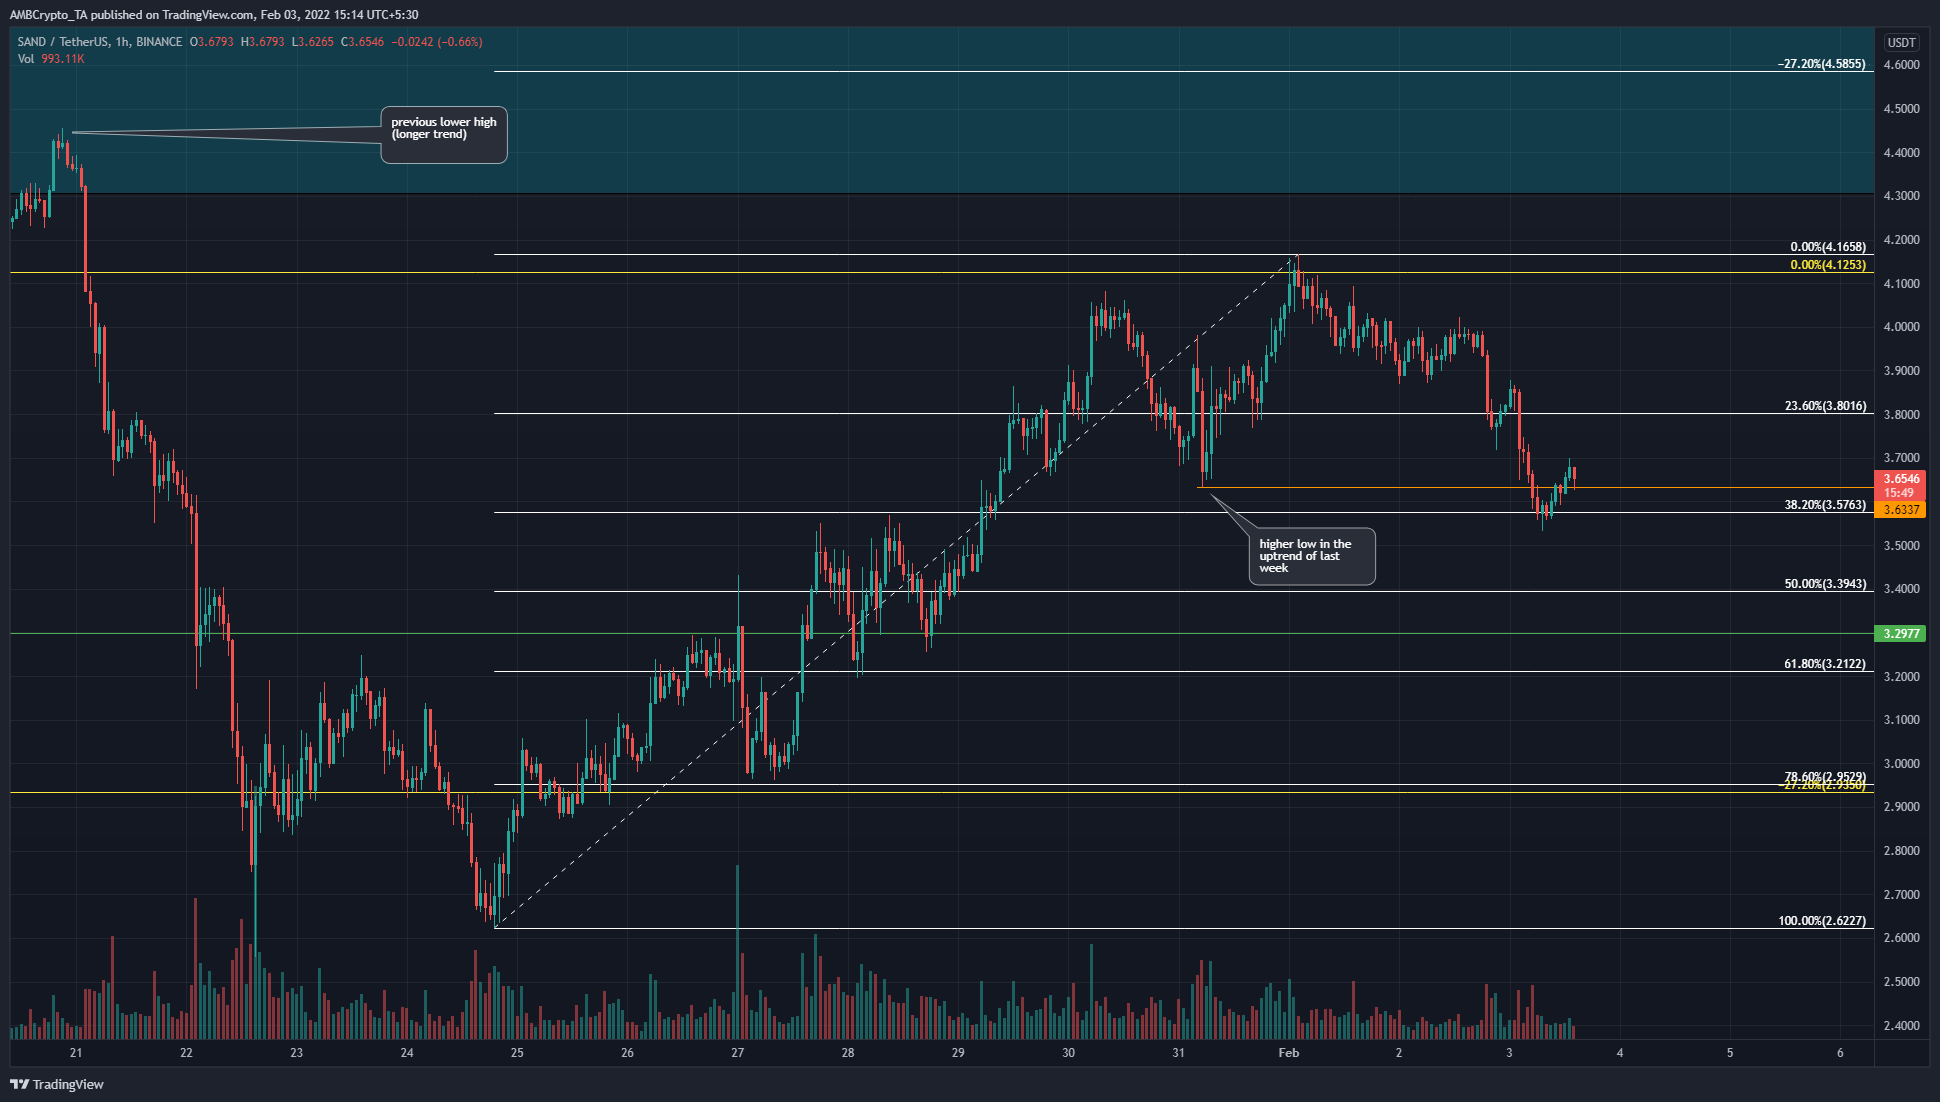
The $4.5 area (cyan box) had been defended from the bears for all of December, but in mid-January, the bulls began to get exhausted. Once the scales tipped, the price quickly fell as low as $2.62. Since those lows, the market has seen a relief rally. Alongside Bitcoin, SAND also made steady gains.
The near-term market structure was bullish (previous higher highs and higher lows consistently broken) up to $4.16, but at the time of writing the price has registered a low at $3.54. Considering this development, alongside the fact that the larger trend’s lower highs lay at $4.45, it could be that $4.16 recent highs were a lower high on the overall market structure.
The question before us: was the dip to $3.54 a deviation in a hunt for liquidity or an early sign of a change in market structure? A move lower followed by a lower high could see SAND retrace as far south as $3.2.
Rationale
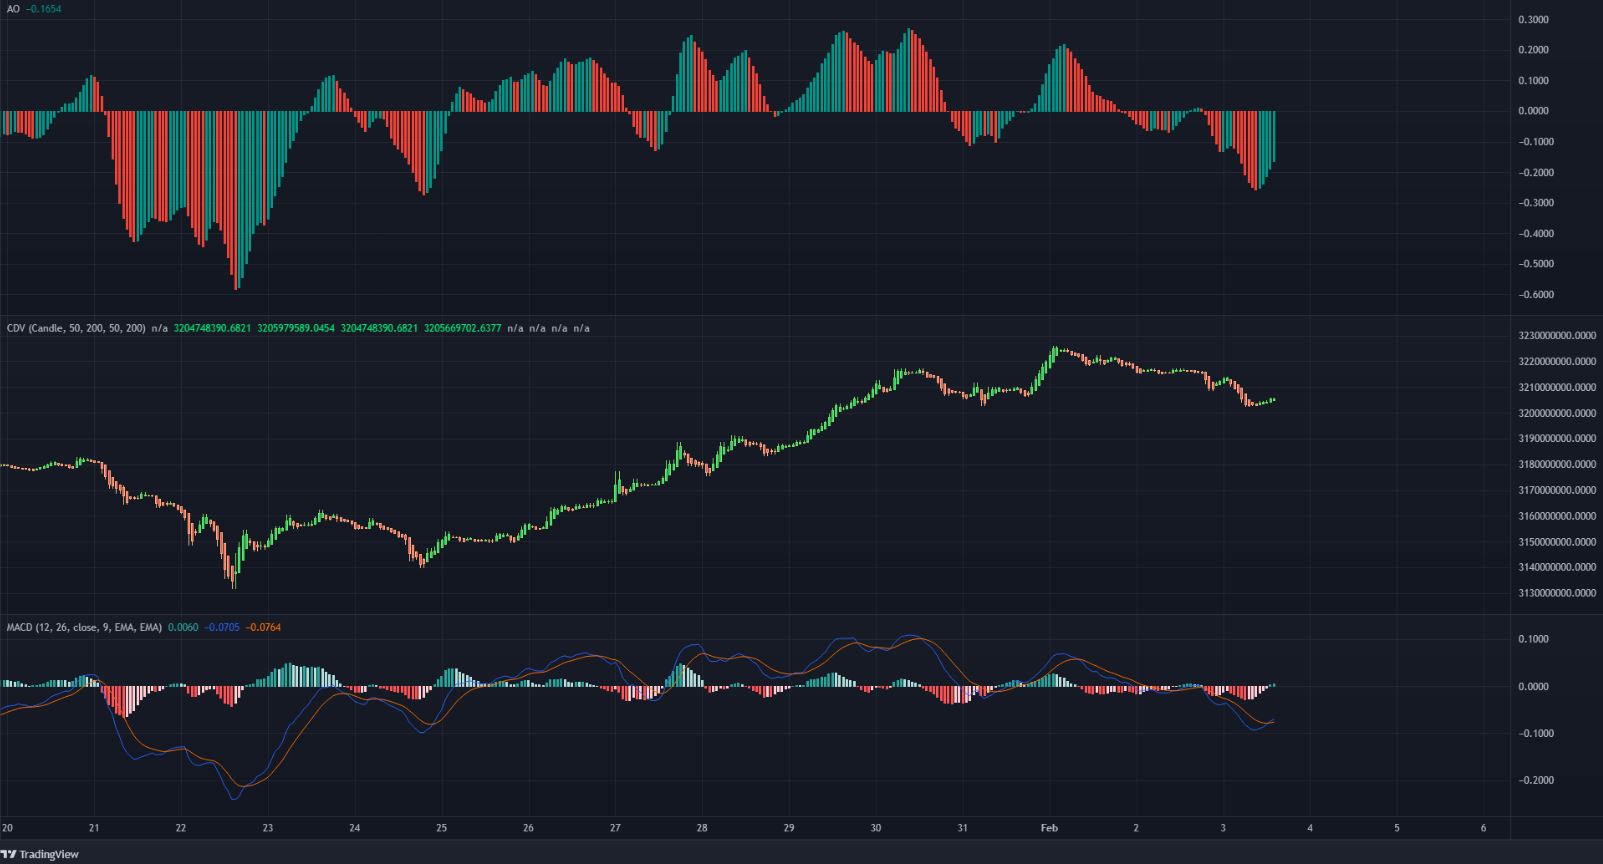
The Awesome Oscillator had been above the zero line for the better part of the last week but in the past couple of days, it has dipped strongly below the zero line to show rising bearish momentum. The MACD also showed much the same thing, although it was on the verge of forming a bullish crossover. This could be an indication of SAND beginning to climb higher once more.
The CDV showed that the selling volume of the past couple of days was slight in comparison to the buying volume on the run-up to $4.16 from the $2.62 lows. This pointed toward a pullback before a move higher, possibly into the $4.5 supply area.
Conclusion
The longer-term market structure was bearish, while in the near-term the picture began to flip from bullish a couple of days ago, to bearish. The $3.8 level did not hold, and it could turn out that SAND was hunting for liquidity at the $3.6 area before retracing the past week’s gains. If such a scenario plays out, the $3.3 level could halt the slide in prices.