Ethereum, Chainlink, MANA Price Analysis: 03 February

As the broader sentiment deteriorated in the last 24 hours, Chainlink fell toward the $15.6-mark. Moreover, the king coin’s movement would be critical to ETH’s trajectory. Should the bulls dwindle, a test of $2,340 would not be of a surprise. On the other hand, MANA saw a bullish divergence with its 4-hour RSI.
Ether (ETH)
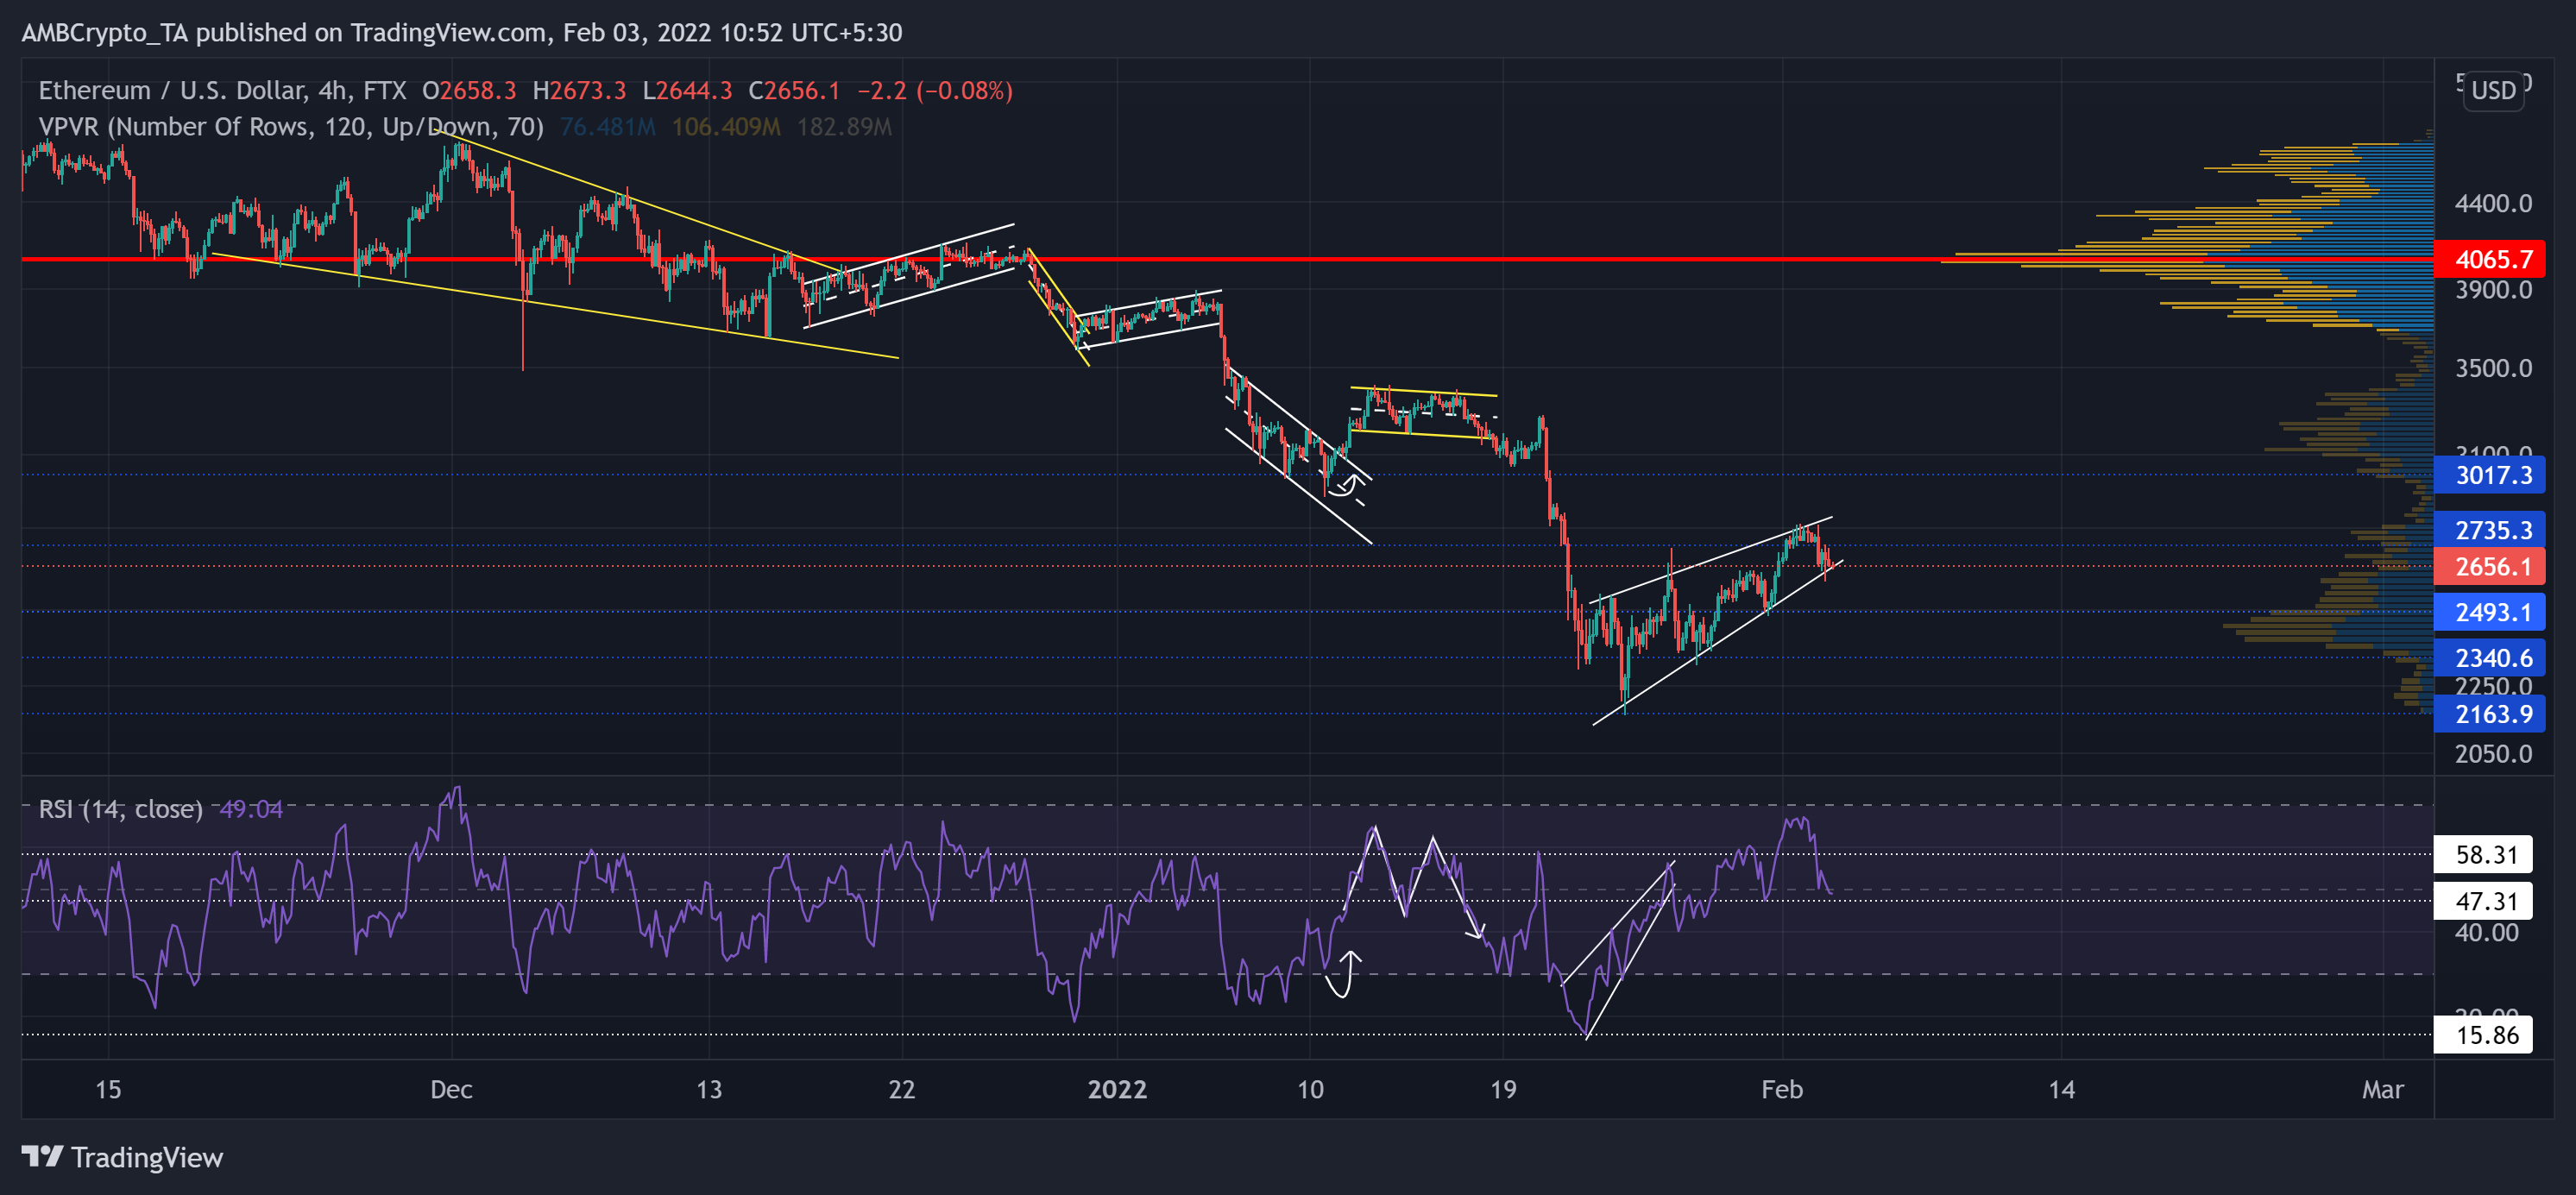
Since losing the Point of Control (red) at the $4,000-mark, ETH bears took over only to initiate substantial sell-offs. As a result, ETH registered a 46.81% loss (from 27 December high) and touched its six-month low on 24 January.
Over the past few days, the king alt witnessed a bearish rising wedge on its 4-hour chart. Now, the immediate resistance stood at $2,735-mark before a likely pullback. Besides, any retracements from here itself would find testing grounds at the $2,400-level.
At press time, ETH traded at $2,656.1. The RSI saw a solid recovery from its record low on 22 January. It revived by over 50 points in the last 12 days while testing the overbought region. In the past few hours, it fell below the half-line. Defending the 47-mark would be vital to preventing a retest of immediate support.
Chainlink (LINK)
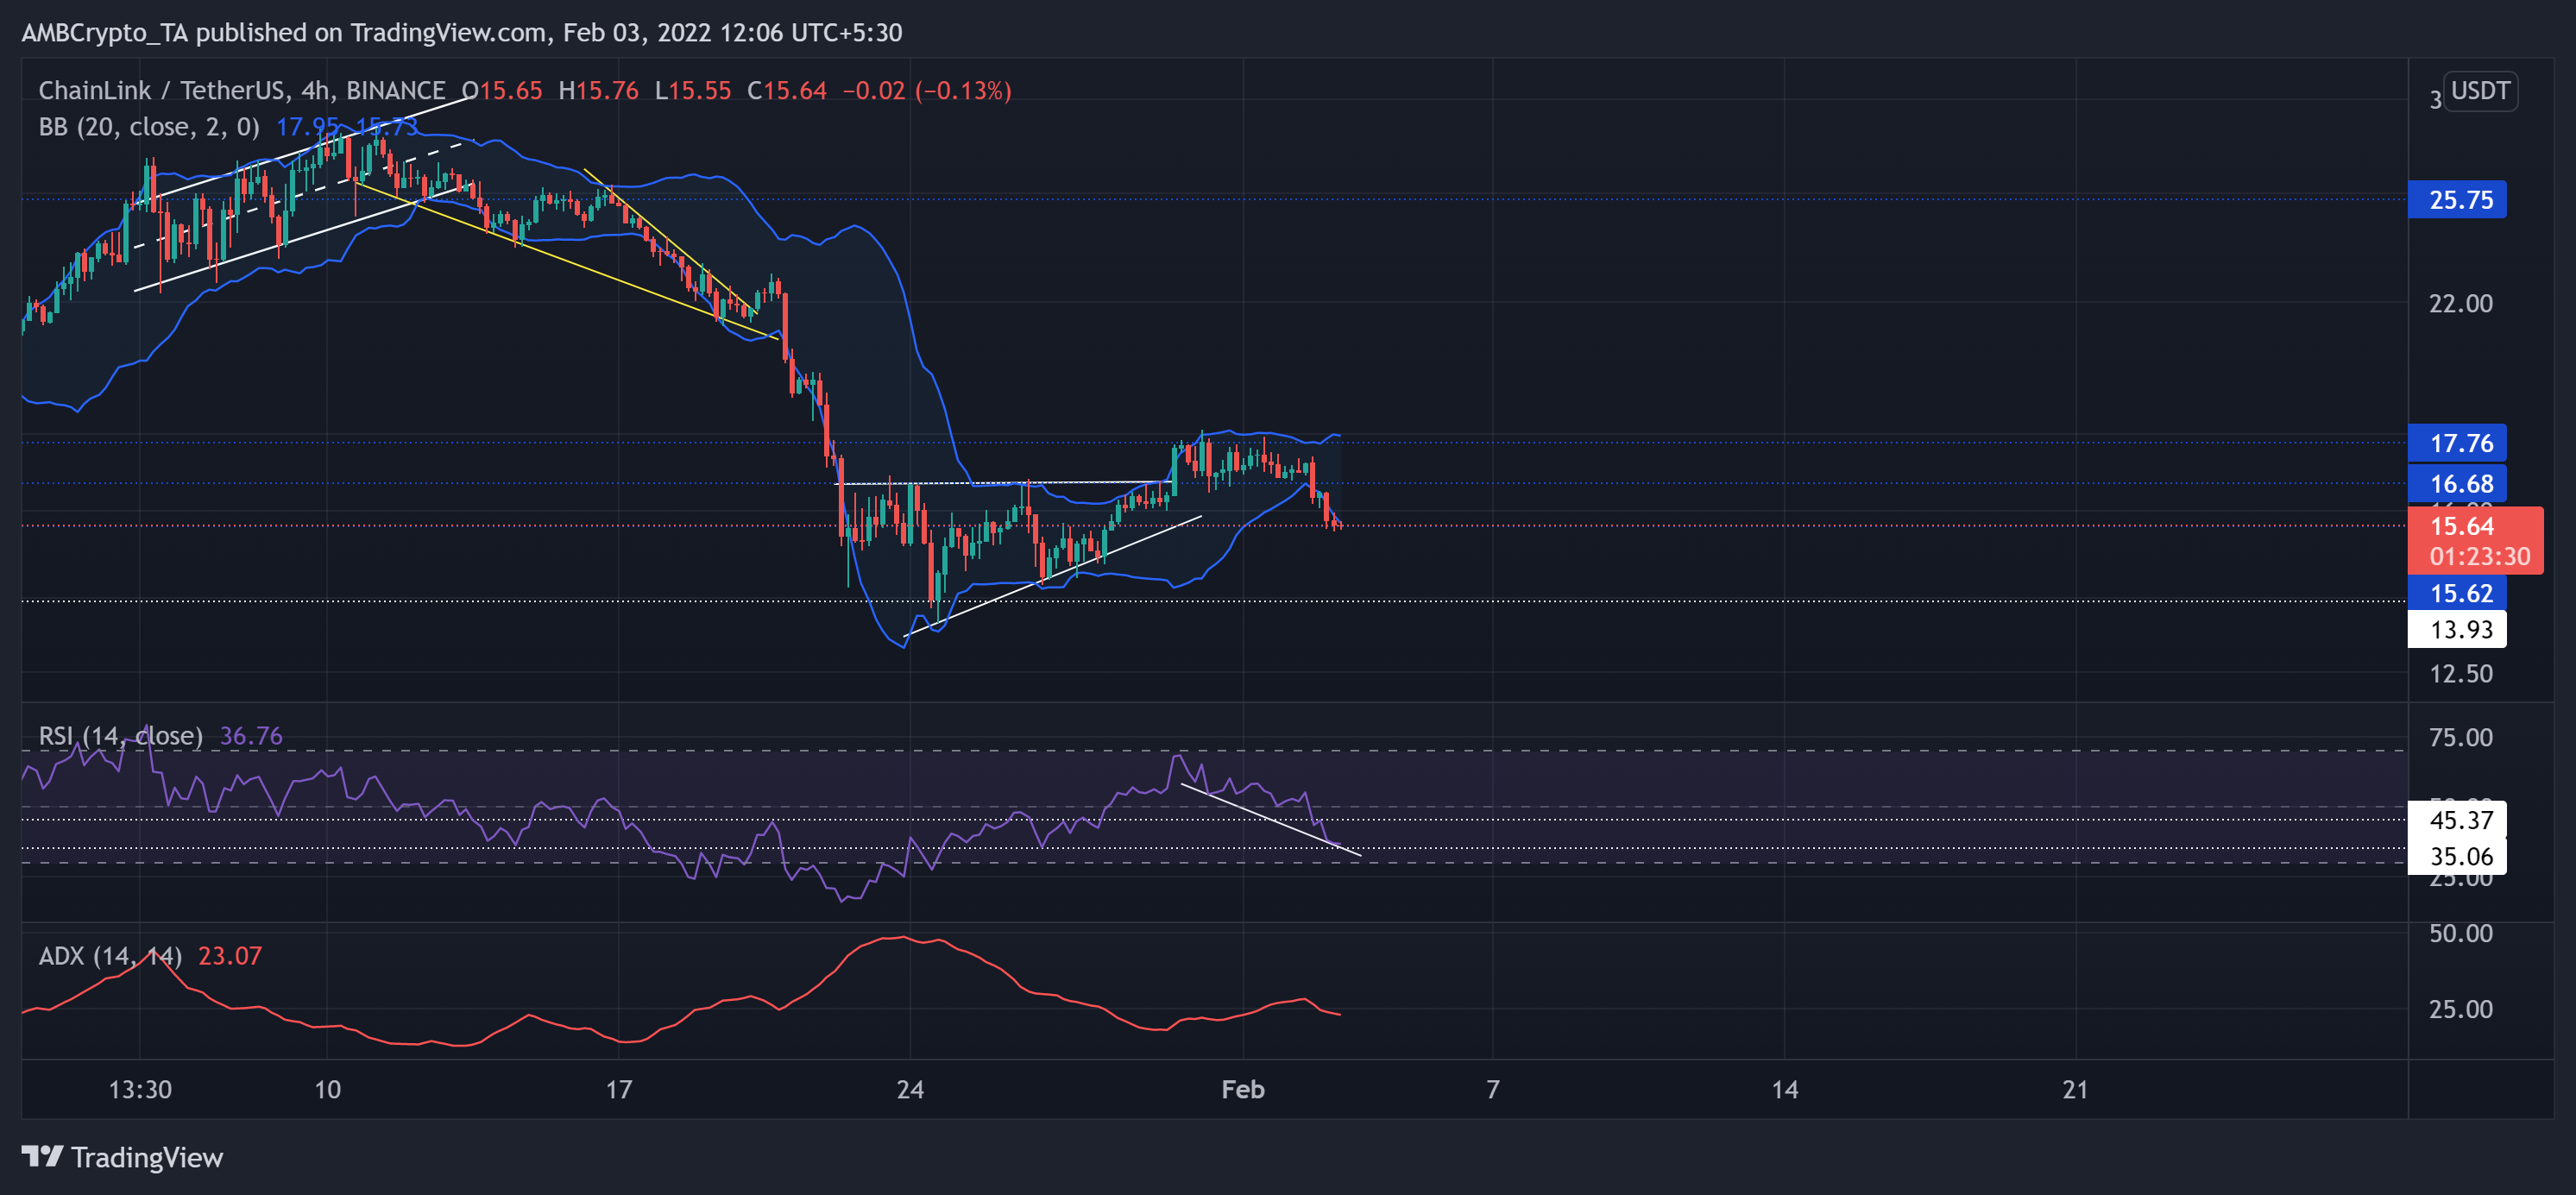
The buyers lost their influence after LINK broke down from the $25.75-level. Thus, LINK plunged by 48.56% to hit its six-month low on 24 January. The bulls finally showed up at the $13.96-mark as the alt recorded a decent recovery since then.
As a result, LINK saw an ascending triangle (white) breakout that failed to cross the $17.76 resistance. Post that, the bears kept testing the $16.6-level until the alt saw a bearish engulfing candlestick on 2 February. Thus, the LINK noted an 8.8% 24-hour loss that found support at the $15.6-mark. Now, any reversals from near the lower band of the Bollinger bands would find resistance at the $16.6-mark.
At press time, LINK was trading at $15.64. After testing the overbought territory on 30 January, the RSI steeply took a downturn below the midline. Any fall below the 35-mark could propel a further downfall. Further, the ADX (directional trend) for the alt stood slightly weak at the time of writing.
Decentraland (MANA)
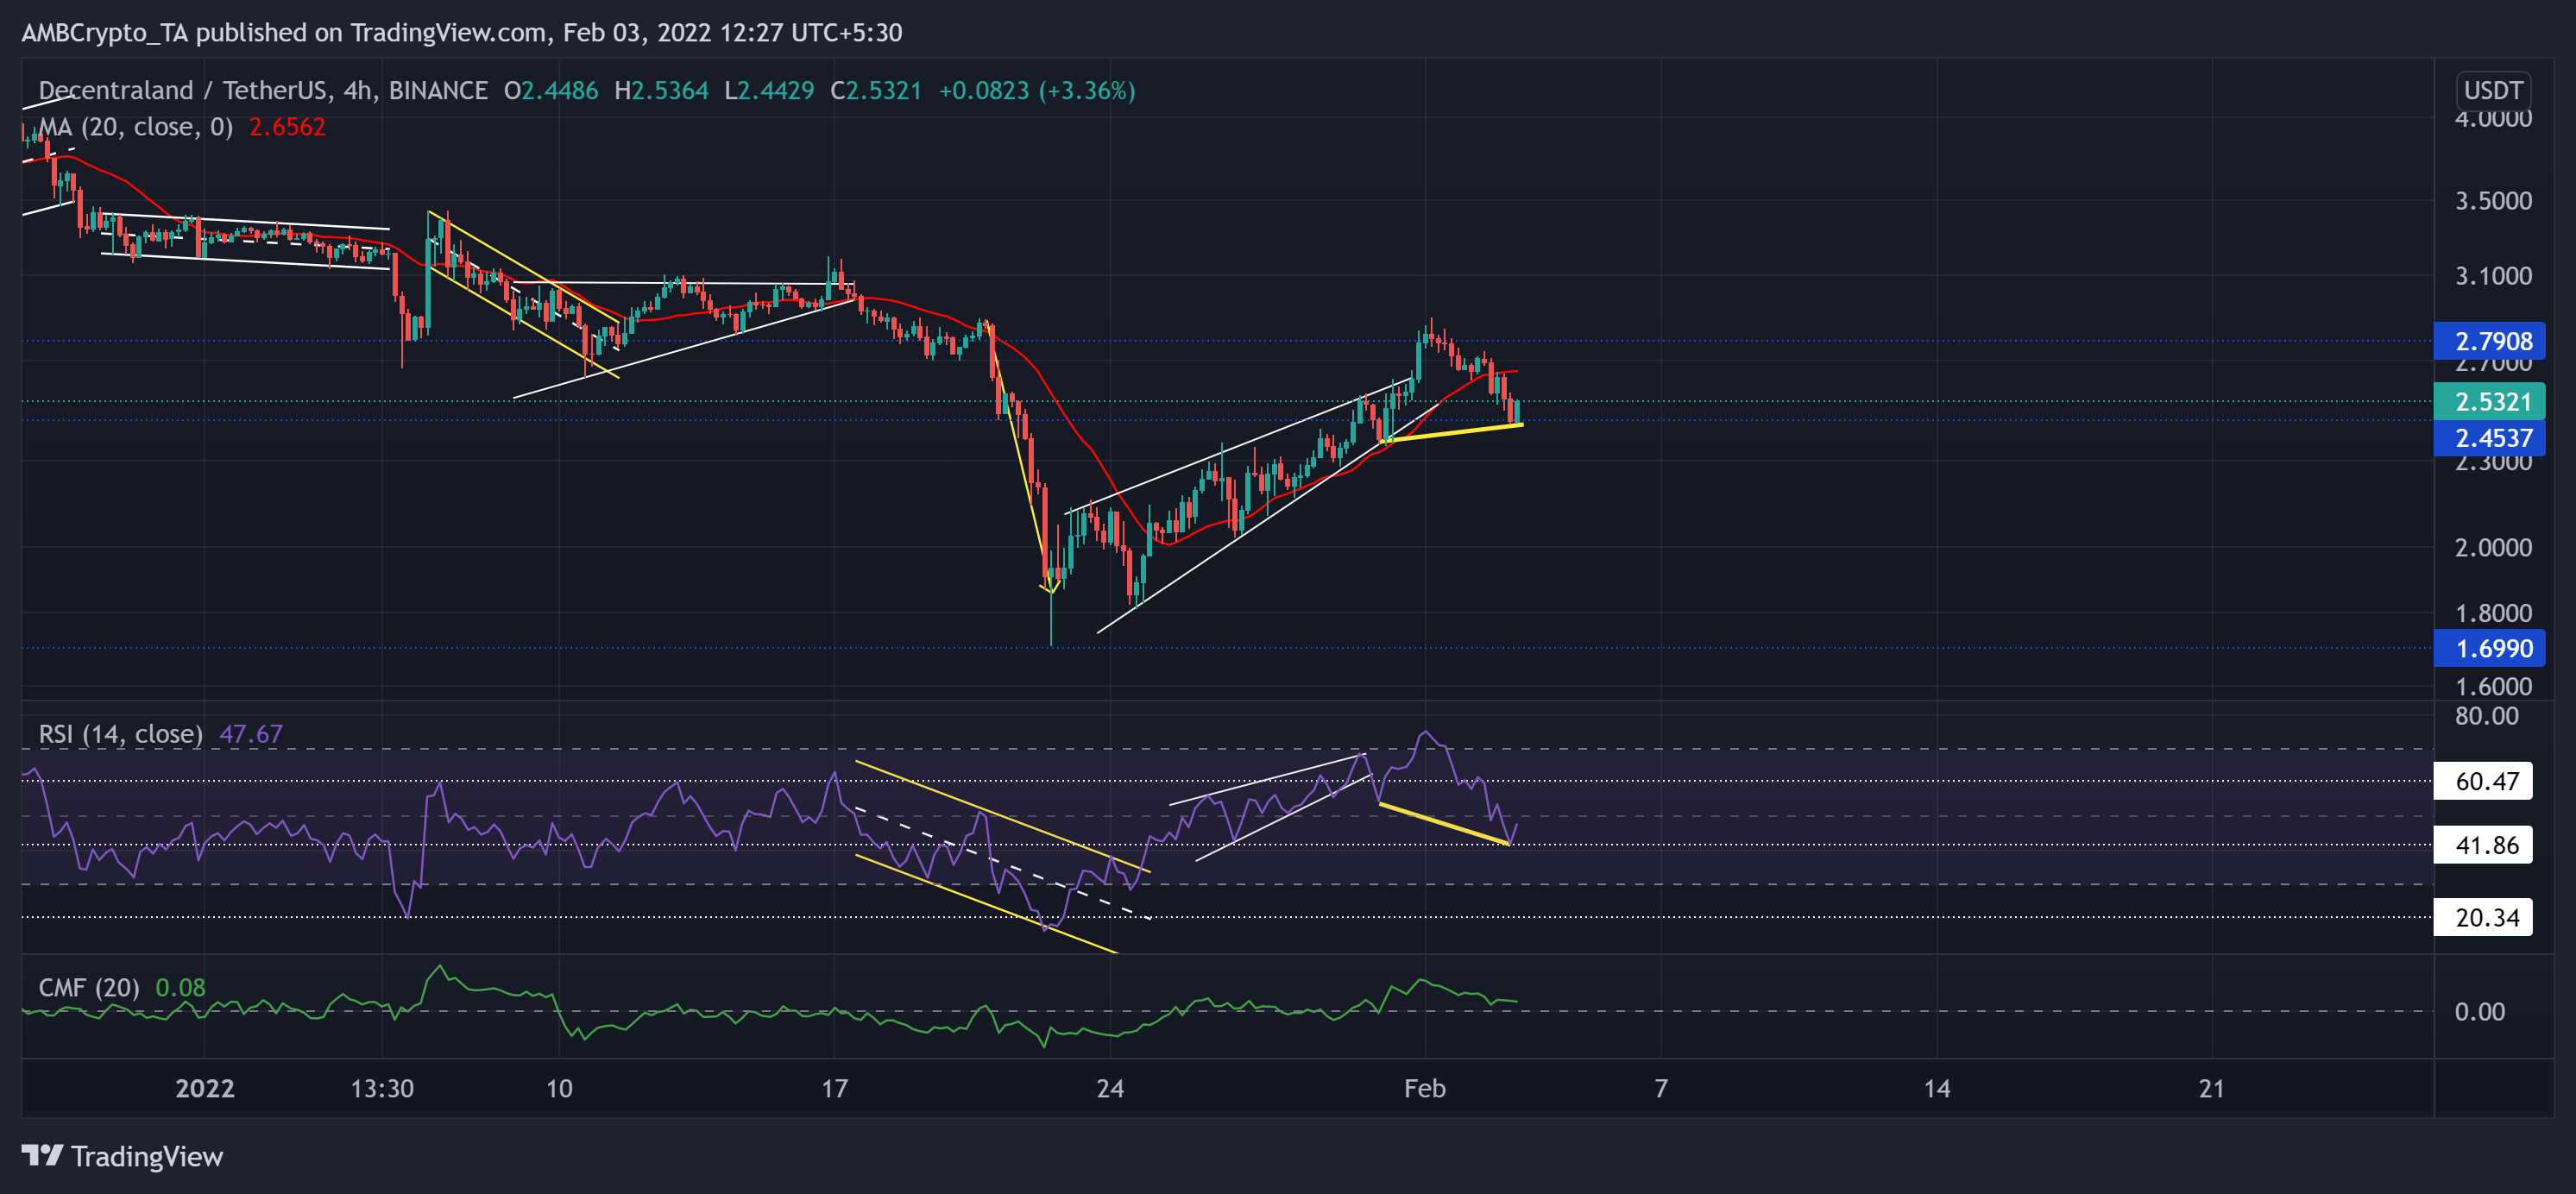
After a nearly 46% loss (from 17 January), it pulled back until its 11-week low on 22 January. Since then, the alt saw a staggering 70% ROI until 1 February while the $1.6 support stood sturdy.
Although it formed a rising wedge, MANA invalidated the bearish tendencies and upheld the $2.4-mark support. Now, the immediate testing grounds for the bears stood at the 20 SMA (red).
At press time, MANA was trading at $2.5321. Since falling from the overbought region, MANA’s RSI bullishly diverged (yellow trendline) with its price in the last few days. Also, the CMF managed to keep itself above the zero-line, hinting at a bullish edge.


