SAND’s descent this way could trigger shorting signal for traders

Disclaimer: The findings of the following analysis are the sole opinions of the writer and should not be considered investment advice
SAND’s break below $3.3 triggered a patterned breakout under its 20/50/200 EMA. This trajectory propelled a downward slide for the digital asset at the $3.3-level and marked a bearish beginning.
From here on, SAND eyed a retest of the median (red) of its pitchfork in the $2.70-zone. Then, bulls will likely provoke a test of its upper trendline (blue) before a trend committal move. At press time, SAND was trading at $2.7154, down by 7.12% in the last 24 hours.
SAND 4-hour chart
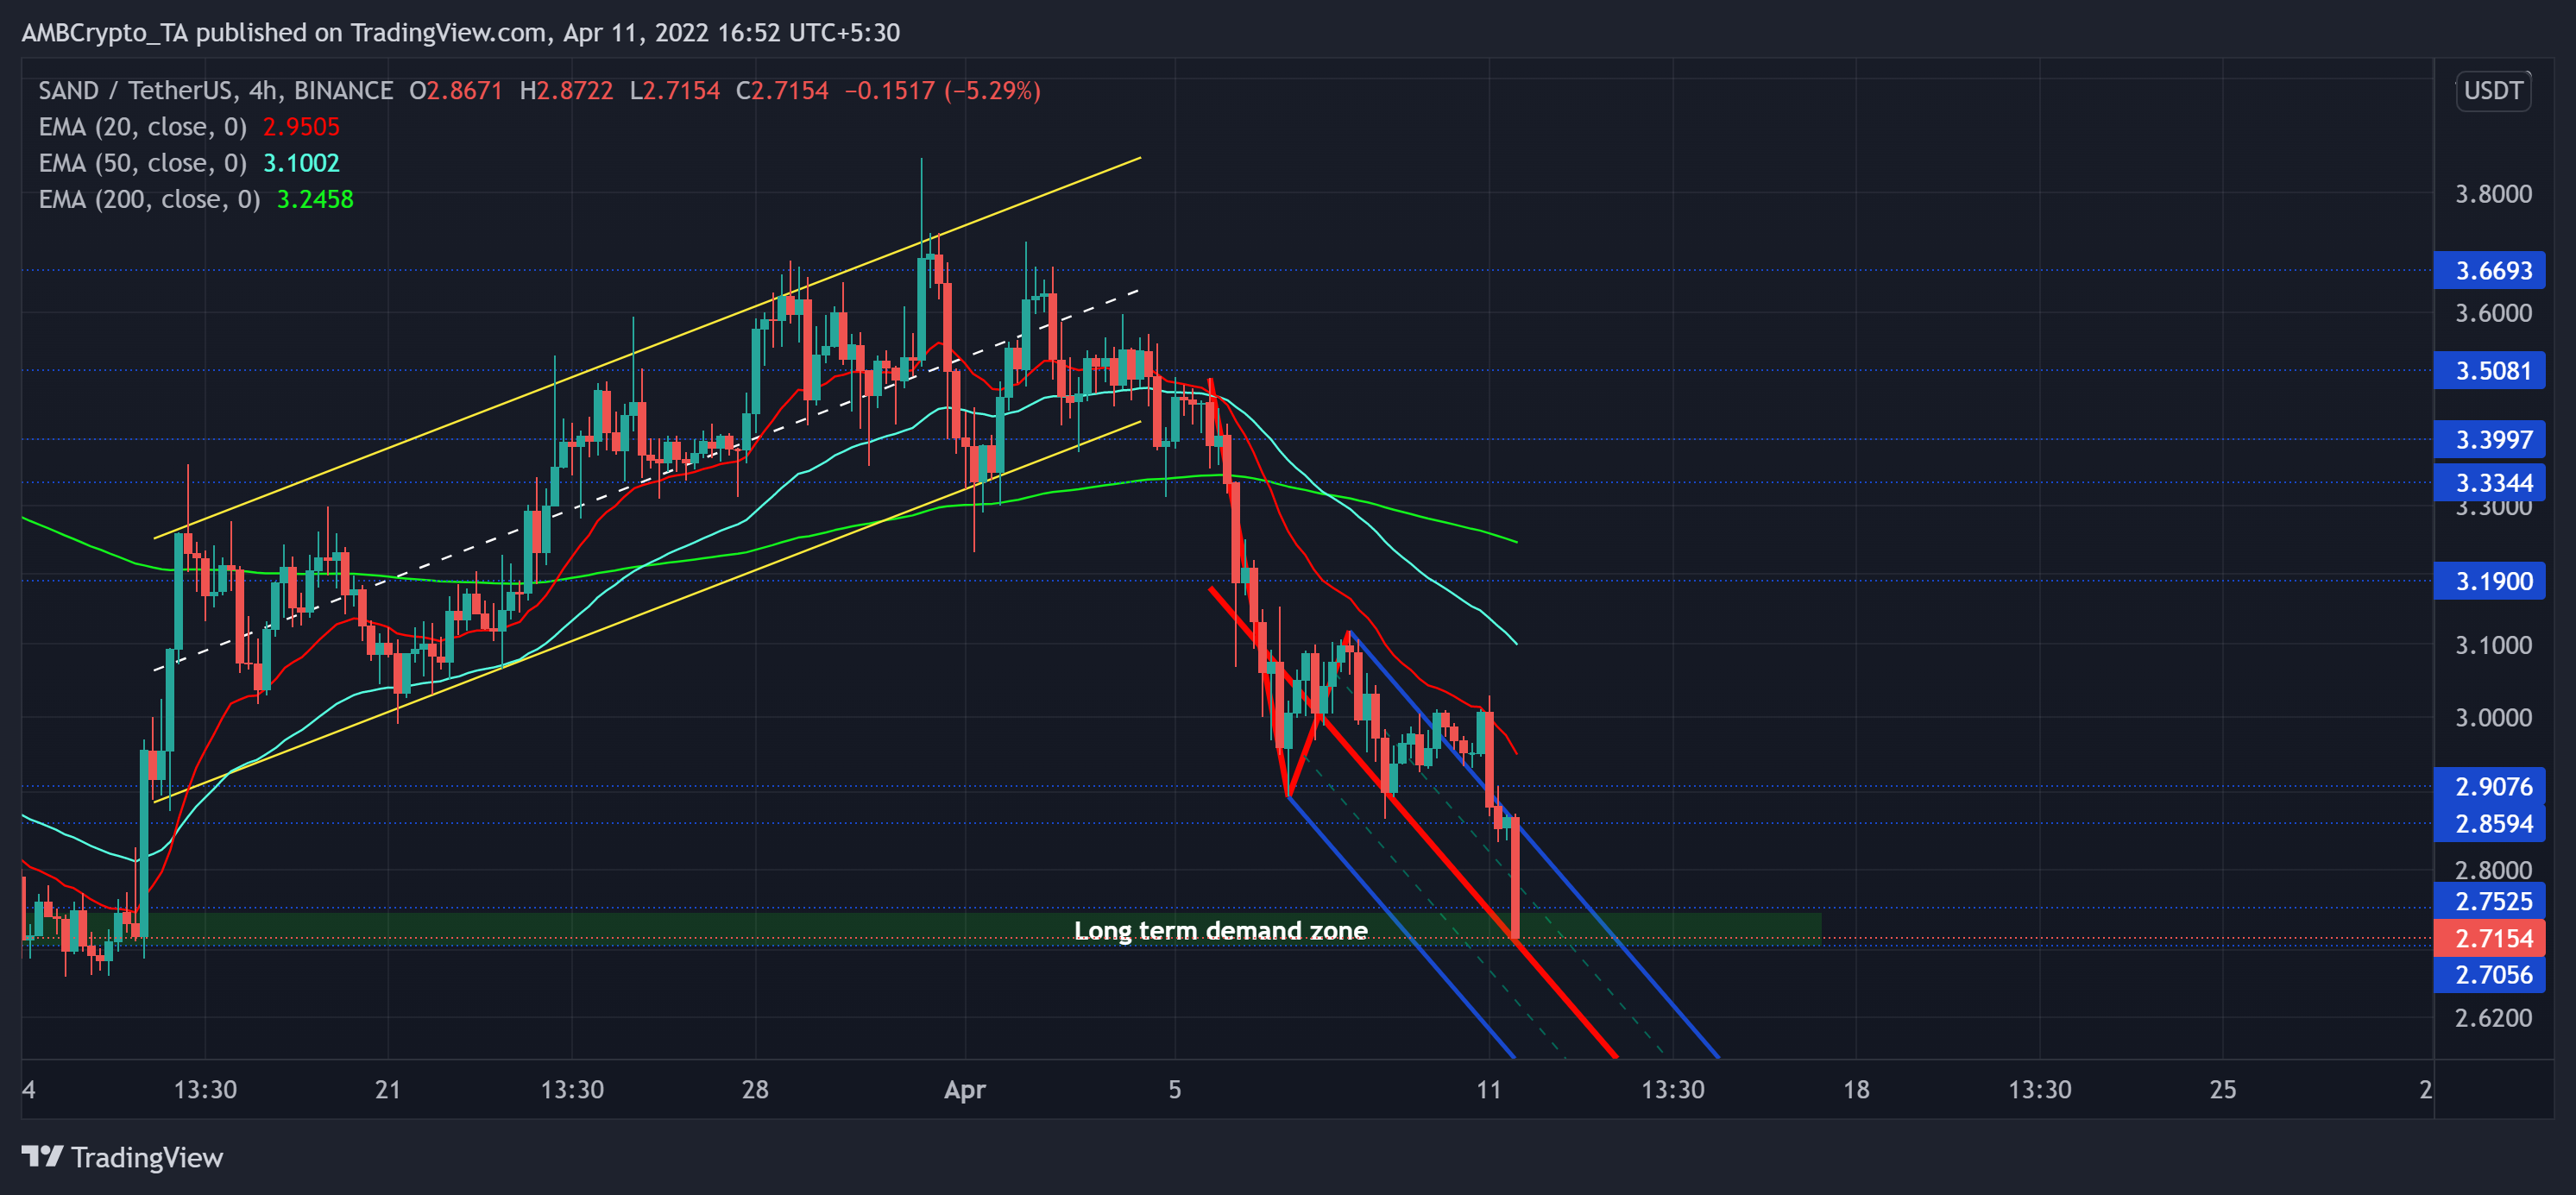
Since its ATH on 25 November, the bears have persistently marked lower peaks while the bulls upheld the $2.7 demand zone for nearly five months. This movement pictured a superior bearish vigor as the sellers refrained from allowing the bulls to mark higher peaks on a longer timeframe.
The recent up-channel rally from its long-term demand zone halted at the $3.6 resistance. Consequently, SAND was down by nearly 26.3% over the last nine days.
The pitchfork tools’ median visibly offered strong support over the last four days. So, a likely retest of the median could propel a near-term recovery towards the $2.8-zone. On its way up, the altcoin would face a barrier at the upper trendline of the pitchfork before the buyers gather enough thrust for a powerful rally.
Rationale
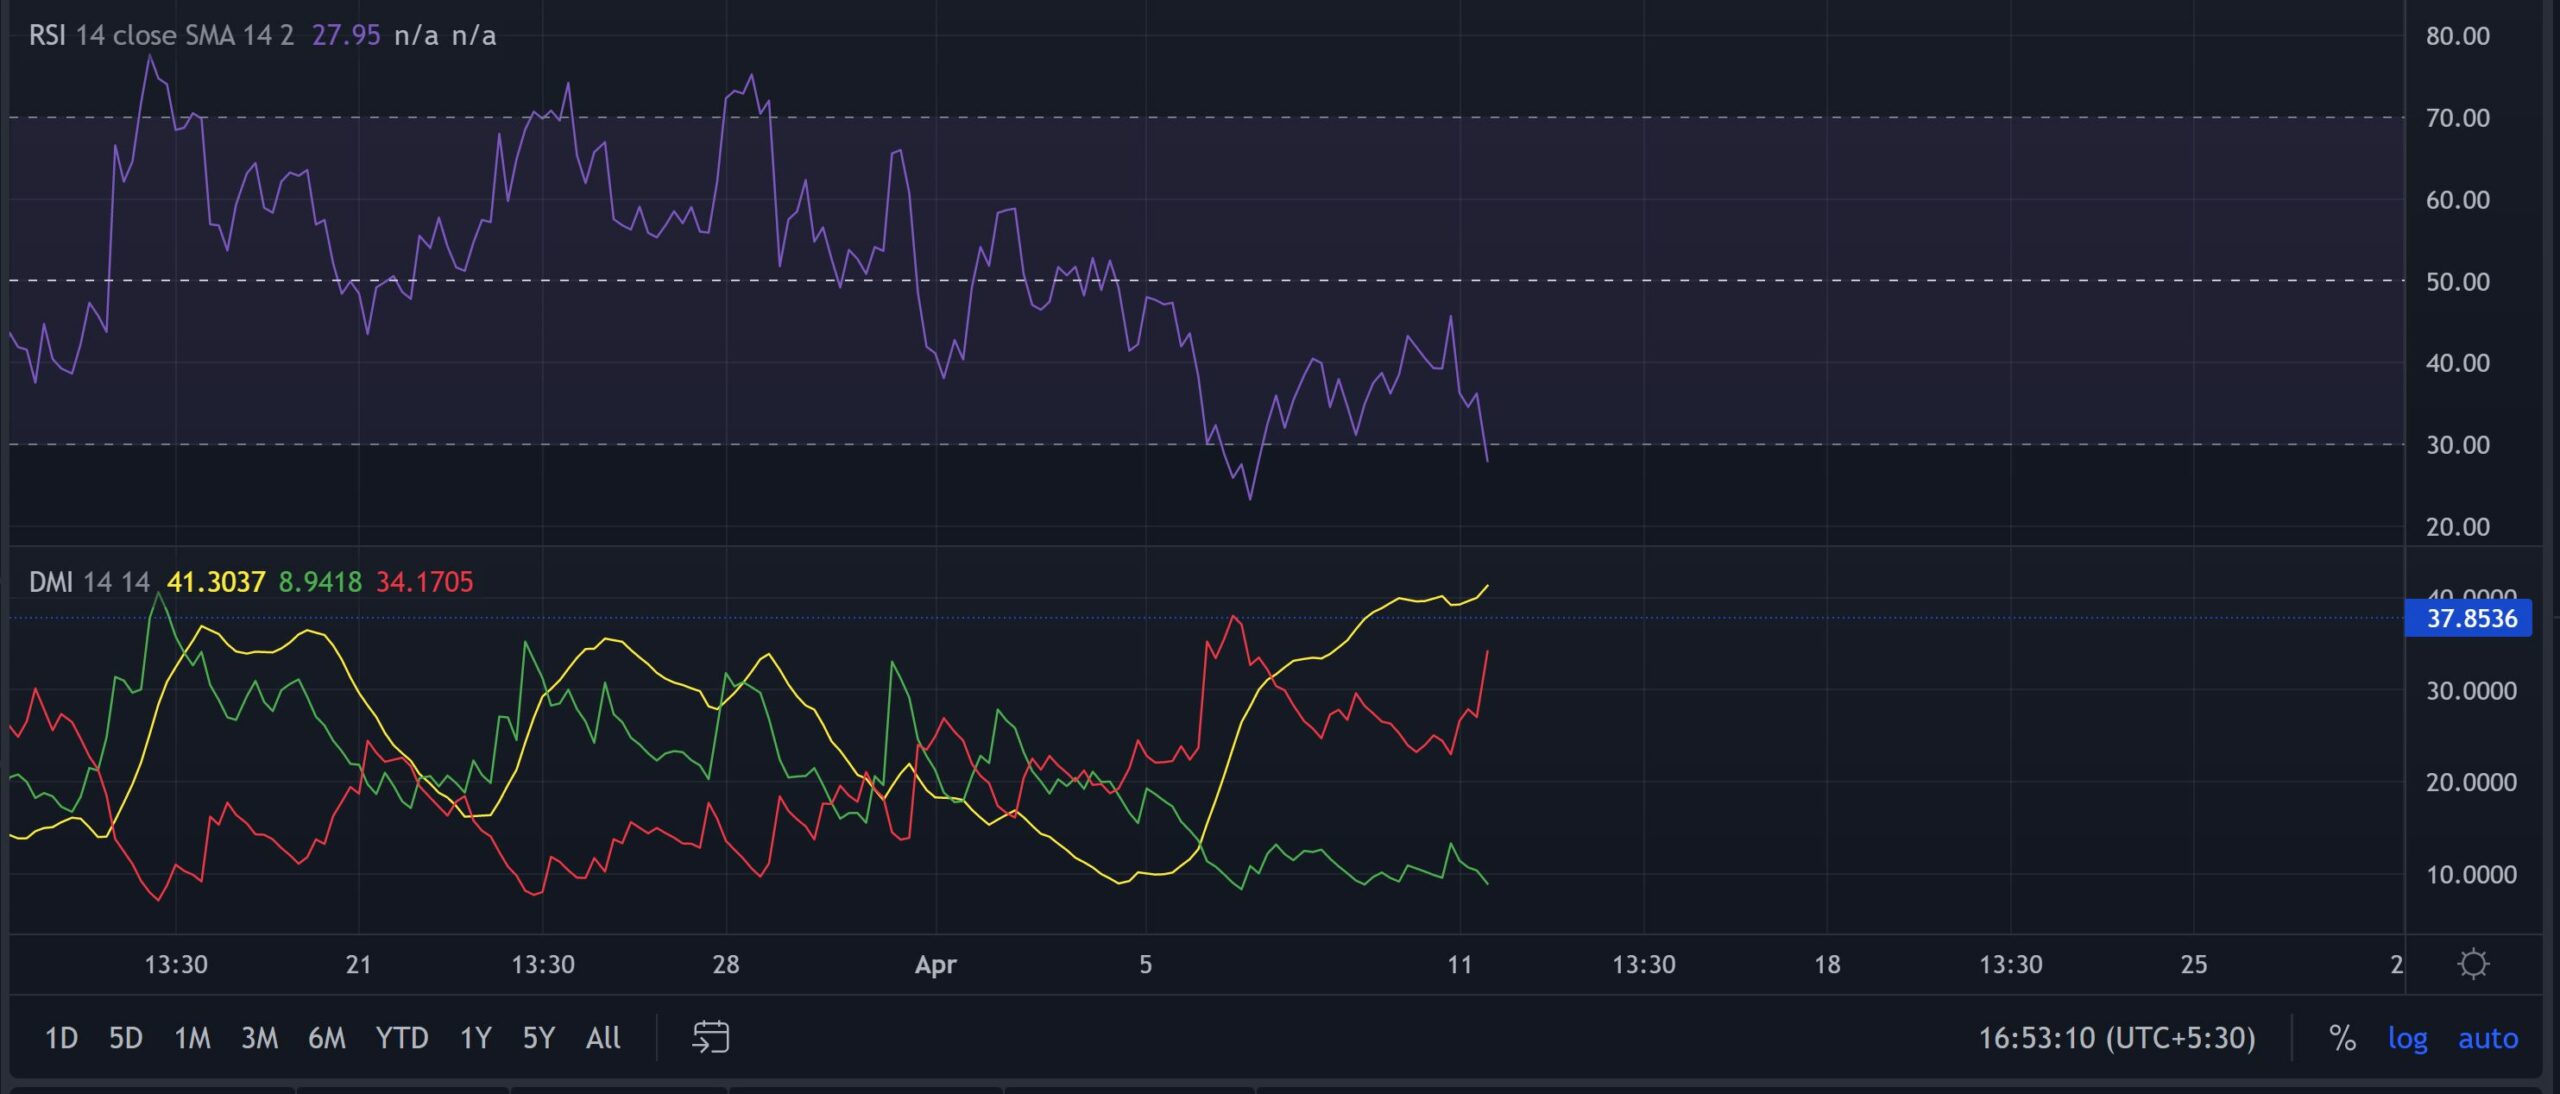
The southbound RSI was struggling to halt the rapid fall as it entered the oversold region. A likely reversal from this level would confirm a bullish divergence with price.
With the -DI looking north, SAND would test its five-month support before any revival chances towards the $2.8-$2.9 mark.
Conclusion
Considering the oversold reading on its RSI and the sturdiness of its five-month support, SAND could bounce back from its immediate support level. On the flip side, a close below the $2.7-mark would trigger a shorting signal for the traders.
Besides, the alt shares a staggering 89% 30-day correlation with the king coin. Hence, keeping an eye on Bitcoin’s movement would be vital to complement these technical factors.


