Selling your Bitcoin holdings? You might want to take a look at this

We have been in a bear market for a while now, and it does not look like it’s going to stop anytime soon. Of course, we cannot forget about Bitcoin [BTC], the coin with the most market capitalization and the one whose price fluctuations affect the market as a whole whether it is in an uptrend or a downtrend.
Here’s AMBCrypto’s Price Prediction for BTC for 2022-2023
The mining industry has likewise had its most trying year ever, with mining difficulty rising and income falling. However, there are indicators that show Bitcoin’s value has actually increased over time, suggesting that the recent price action is not a collapse.
Metrics are less bleak
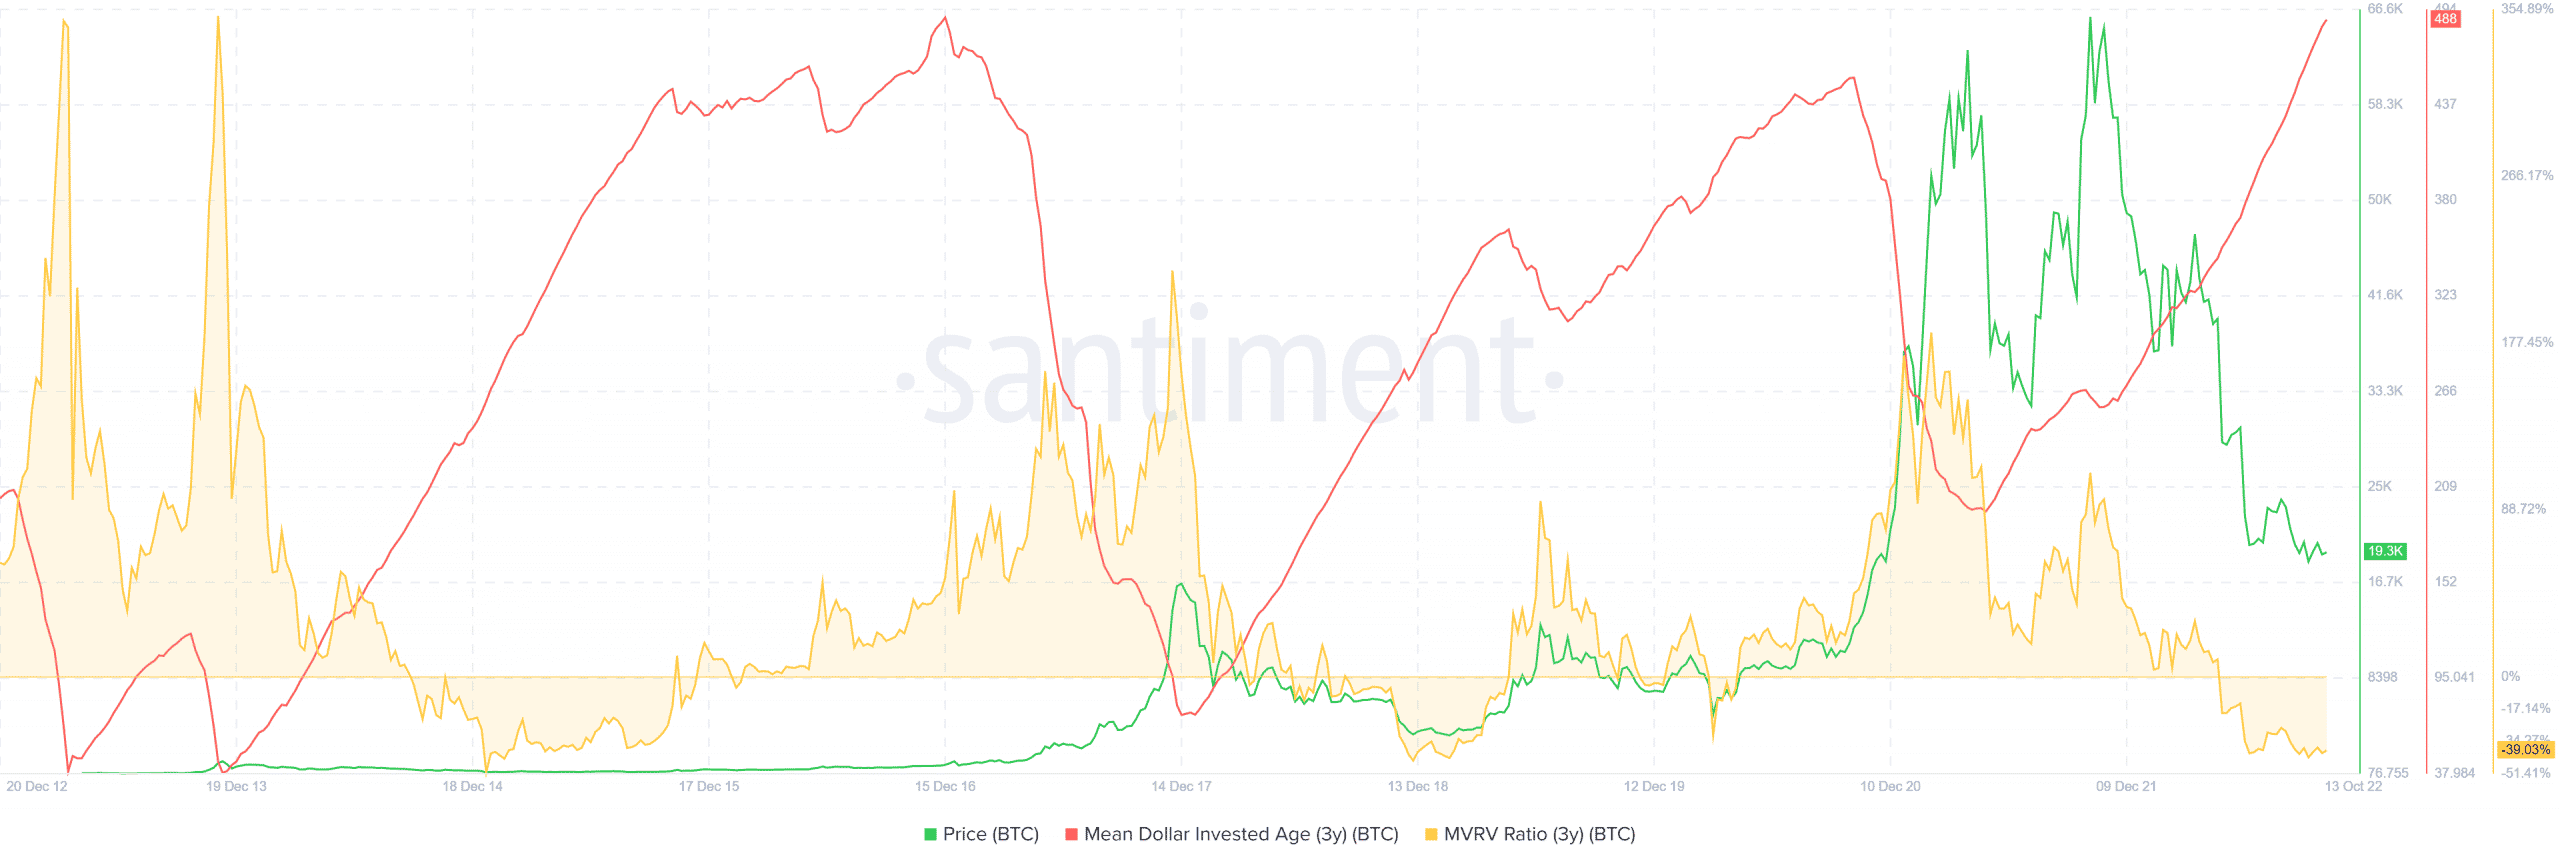
Using the data provided by Santiment, we could observe that the Mean Dollar Investment Age metric had reached a record high.
It was seen at over 66, the highest it had been over the years. This means coin distribution will be delayed for quite some time. The MDIA index has been shown to be a reliable predictor of bull and bear markets when looking at historical data.
The MDIA rises to extreme heights during accumulation years like 2017. However, significant declines in MDIA are correlated with subsequent price declines. Thus, suggesting that BTC purchased at expensive rates is being returned to exchanges.
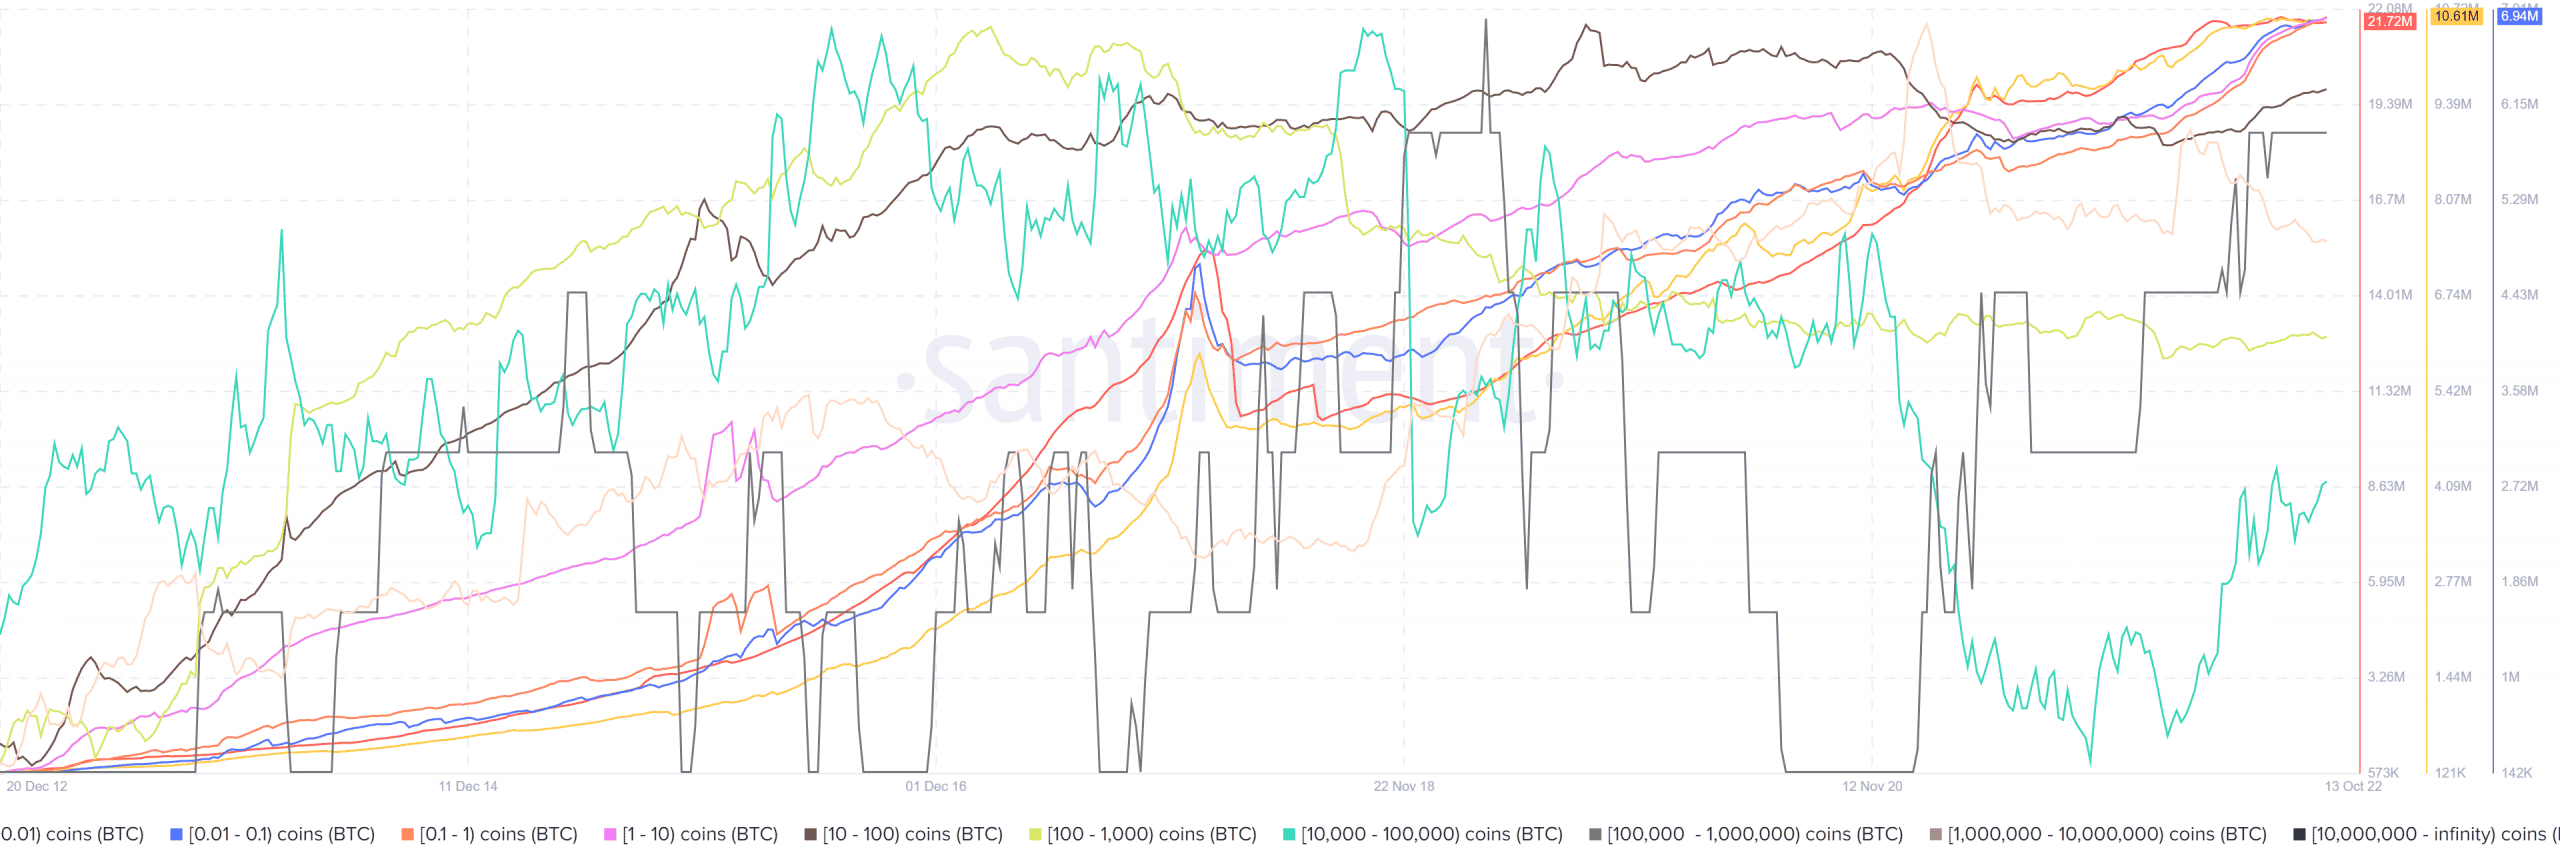
Additionally, a glance at the BTC supply distribution statistic revealed that in October, there were more holders of 1000–10,000 BTC than there were in January of this year.
A review of the distribution statistic also revealed that from January till the present time, over 13,000 holders had consistently held between 100 and 1,000 BTC.
73% down but not out
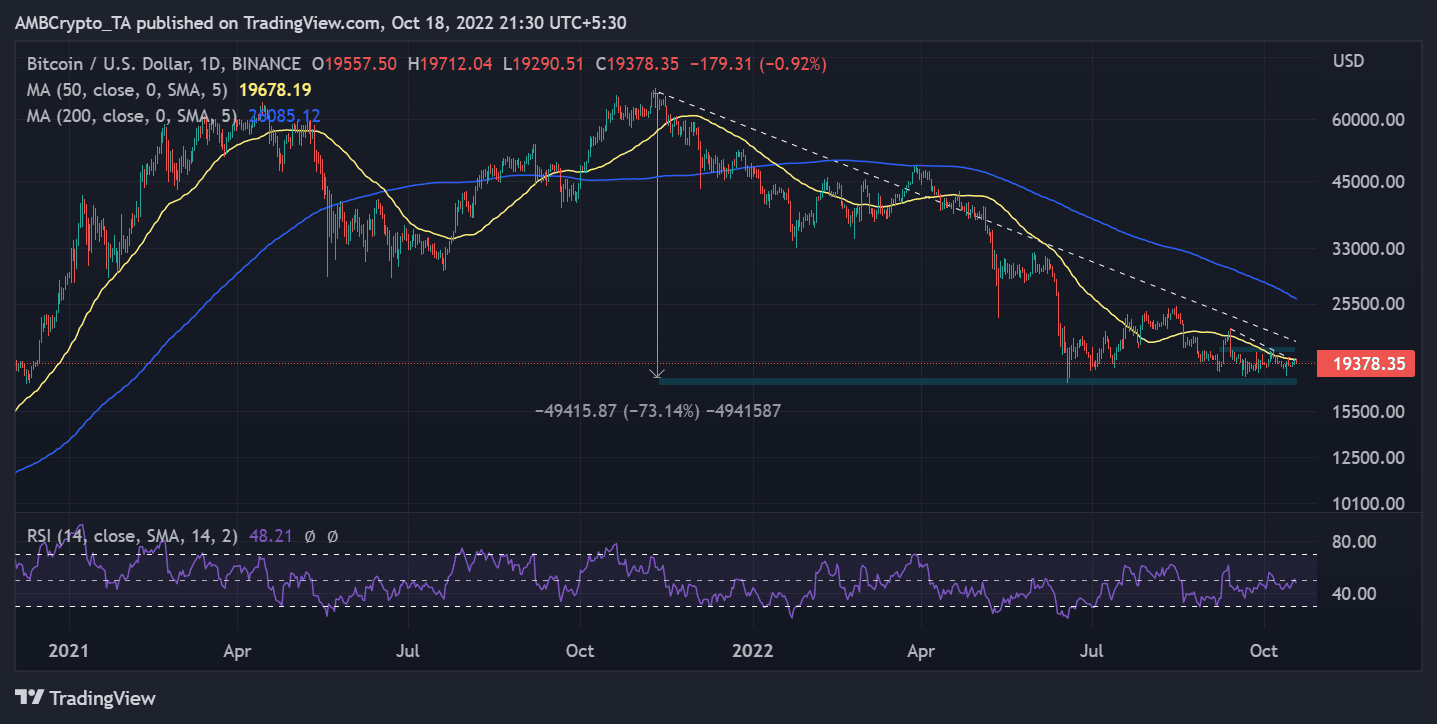
When examining the price trend of BTC going back as far as November 2021, it was clear that the price had been declining, as was to be expected.
It had decreased by more than 72% from the point it was in November 2021, when it was roughly $67,000. Although it was tested a few times, as could be seen on the chart; the trend line also functioned as resistance.
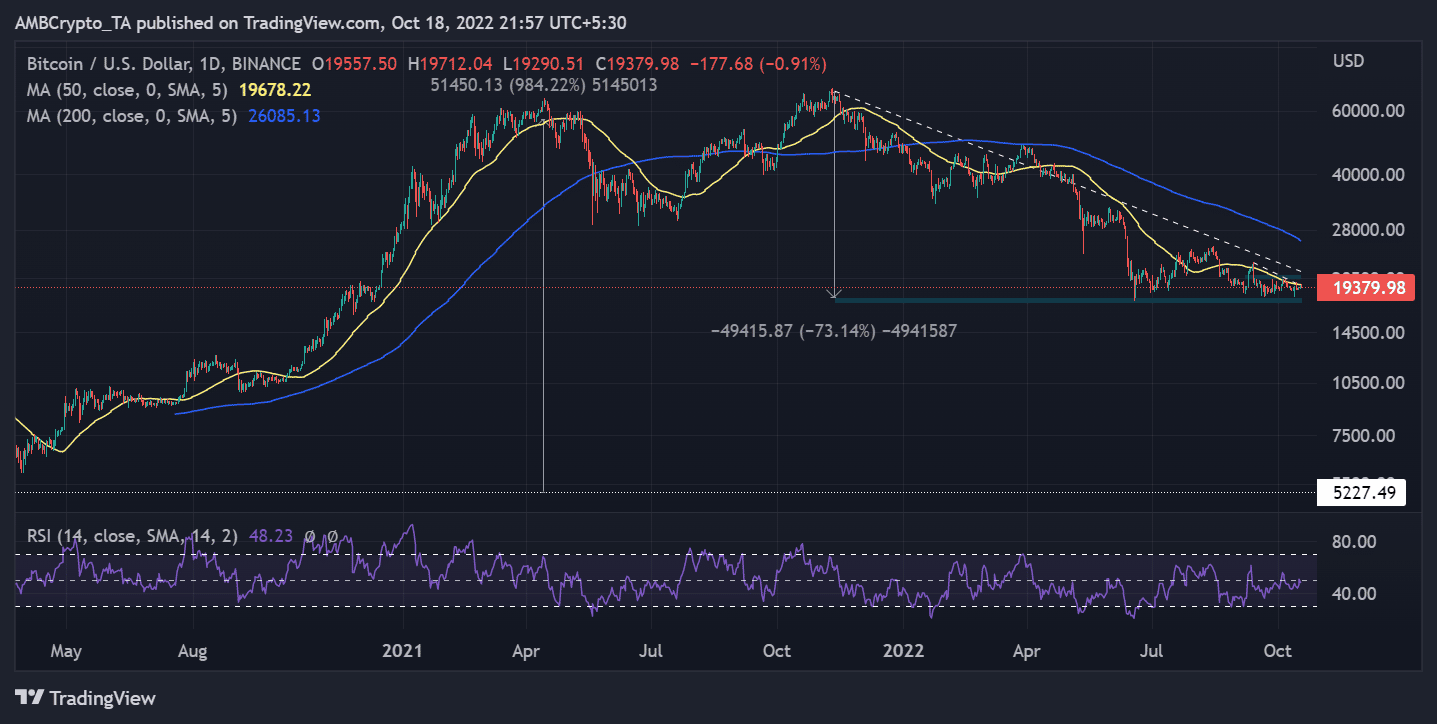
Over a 900% growth was seen in the price of BTC from the $9,000 to the $56,000 range it traded in April 2021. The emphasis on the price range is crucial because historically, it has been demonstrated that the percentage by which it can increase can be above 1,000 while the percentage by which it can decline cannot be greater than 100.
The outlook for BTC price movement may be bleak given the mood of the market as a whole.
However, a review of some important indicators and past price alterations shows that BTC has been holding up quite nicely.
BTC’s decent run can further be clearly seen when the current status of the global economy and the subpar performance of fiats are taken into account.