SHIB kick-starts its 80% upswing journey; should traders take profit now

At the time of this analysis, Shiba Inu’s price was showing massive strength amid market-wide weakness. It could likely trigger a massive run-up if certain hurdles are flipped. Adding credence to this outlook are the on-chain metrics that indicate a higher probability of gains in the coming weeks.
Shiba Inu price ignores the noise
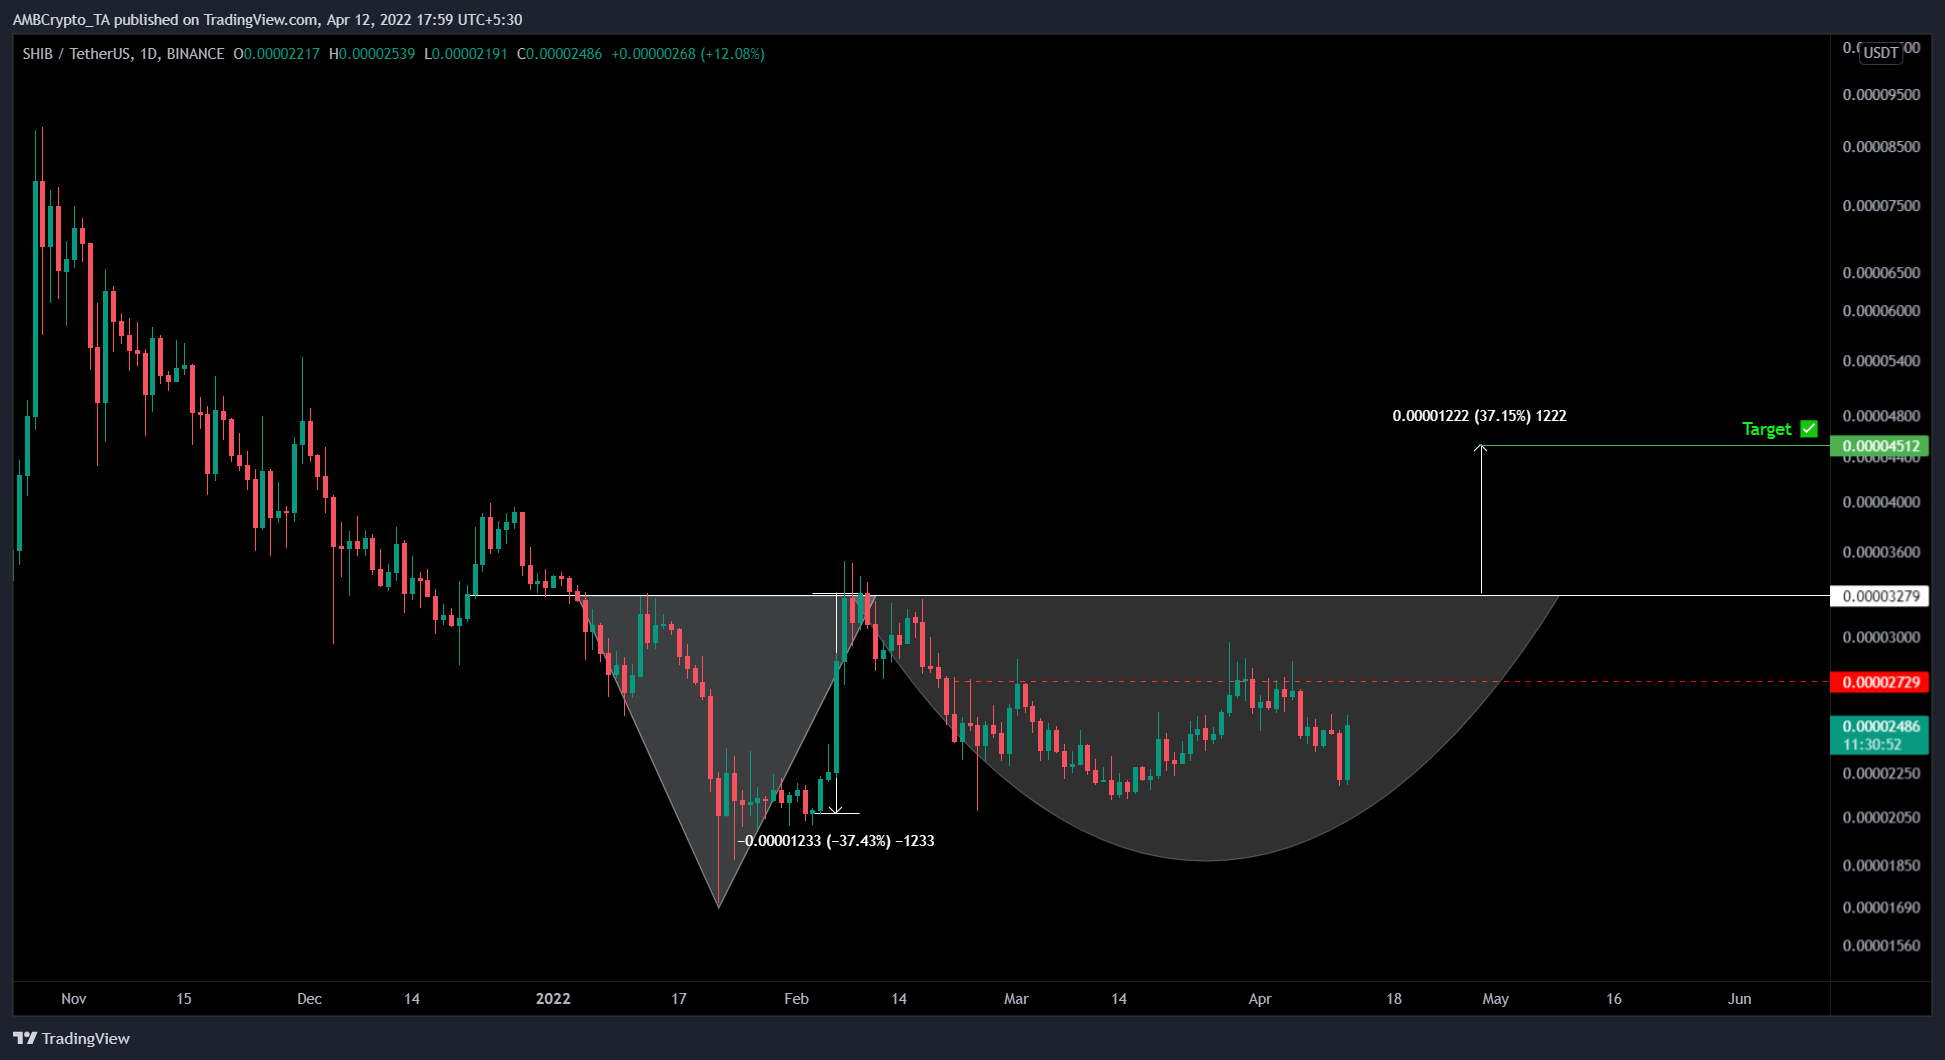
Shiba Inu’s price set up a bottom reversal pattern, known as Adam and Eve, by forming two distinctive valleys after 4 January.
The V-shaped valley is known as ‘Adam’ and the rounded bottom formation is referred to as ‘Eve.’ As seen in the chart, the Eve will be complete if SHIB retests the $0.0000327 hurdle.
The formation forecasts a 3% upswing to $0.0000451, determined by measuring the valley’s depth and adding it to the breakout point at $0.0000327.
Due to the recent announcement of SHIB listing on Robinhood, the price of Shiba Inu has recovered from the recent crash and is hovering around $0.00002899.
If SHIB flips the $0.0000327 hurdle, it will signal a breakout from the Adam and Eve pattern. In such a case, investors can rest assured that the next stop for the bulls will be the target at $0.0000451.
This run-up would constitute a 37% upswing from the breakout point. However, it would amount to 80% gains from the current position. Therefore, accumulating in the current market structure could provide investors with a higher return on their investments.
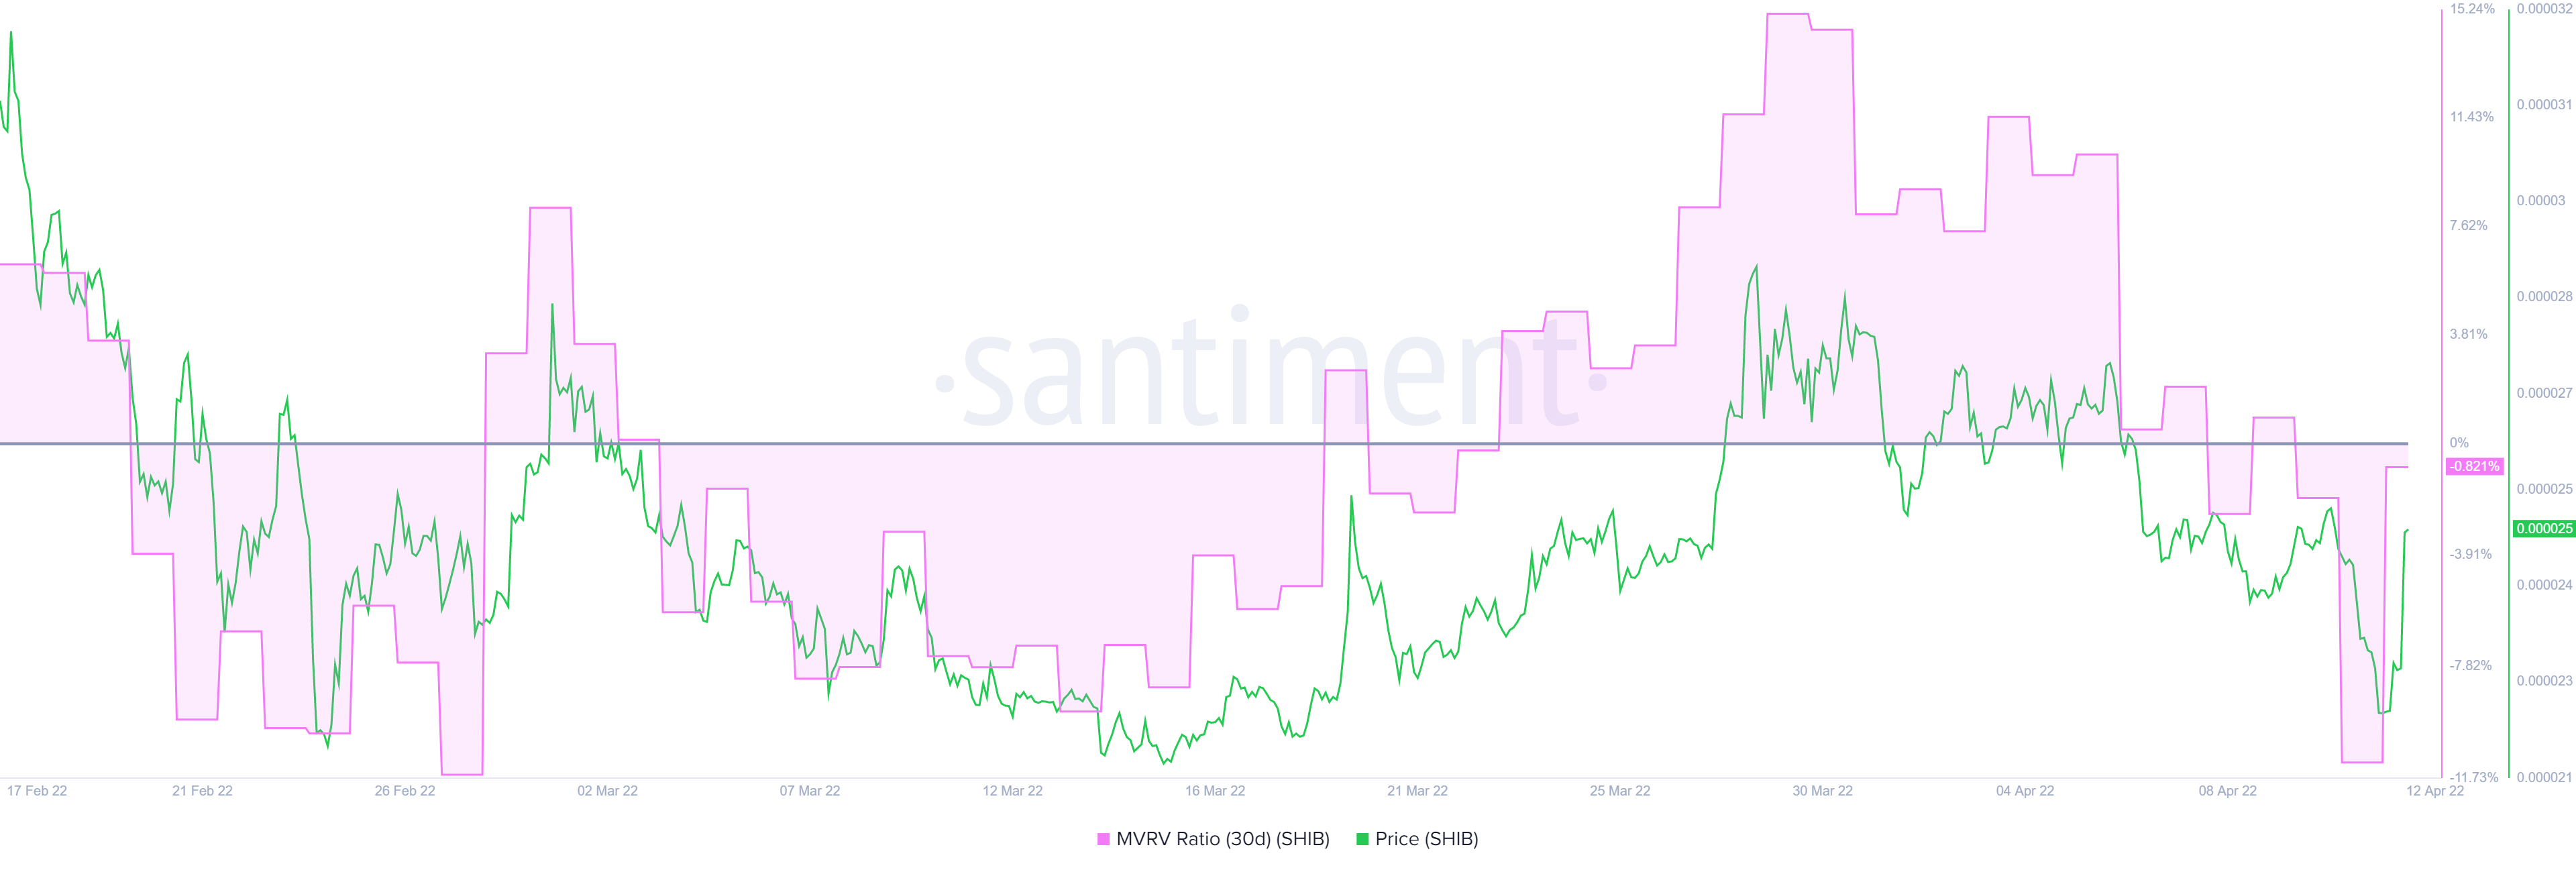
Supporting this outlook for Shiba Inu’s price is the 30-day Market Value to Realized Value (MVRV) model. As mentioned in our previous articles, this indicator can be used to assess the average profit/loss of investors who purchased SHIB tokens over the past month.
A value below -10% indicates that short-term holders are selling at a loss and is typically where long-term holders tend to accumulate. Therefore, a value below -10% is often referred to as an “opportunity zone,” since the risk of a sell-off is less.
Currently, the index is hovering around the zero line after recovery from -11% in under 24 hours. This sudden uptick indicates that many investors are at breakeven.
However, looking at the historical data for the past few months indicates that local tops are formed at around 15%. Thus, suggesting that there is more to the upside for SHIB. Interestingly, this outlook coincides with the views expressed from a technical standpoint.
Hence, investors should keep a close eye out for SHIB as any short-term retracements could be potential levels to accumulate before a massive run-up that could nearly double the investments.