SHIB, LINK and Uniswap Price Analysis: 25 February

As the Ukrainian crisis continued to unfold, the global crypto market took a sharp plunge down the charts. However, the last few hours have observed the market recovering from the dip. The likes of SHIB, LINK and UNI bore similar patterns of recovery since the day before.
Shiba Inu (SHIB)
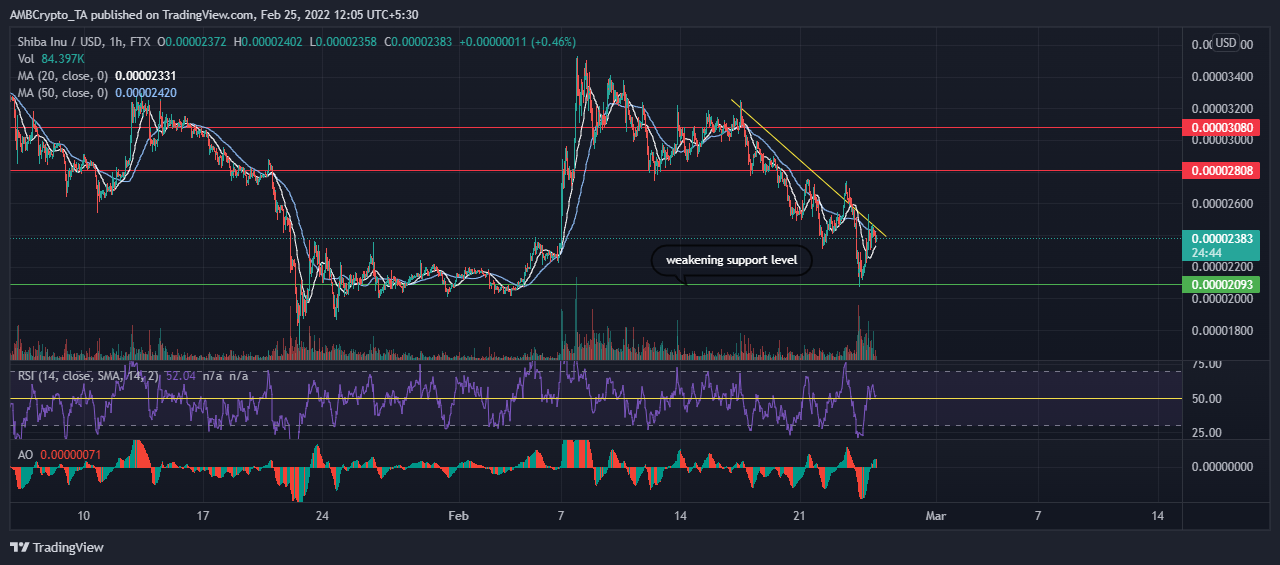
Shiba Inu (SHIB) gained critical support at $0.00001743 on 22 January after the market crash in December. Trading in a range, the coin enjoyed a steep climb, hitting resistance at $0.00003511 on 8 February. However, since 17 February, SHIB gradually followed a downtrend until the previous day, when the alt finally retested the support at $0.00002093-level once again.
As the market dropped considerably owing to increasing conflict between Russia and Ukraine, SHIB had dropped from $0.00002741 to $0.00002093 the previous day. However, over the past few hours, the market was able to pull back and owing to a supportive buying strength, the alt was able to bounce back. The RSI swayed at 46.40 after recovering from the oversold territory the previous day. It was confirmed by the AO which recovered from the depths and resurfaced over the zero line over the past few hours.
Chainlink (LINK)
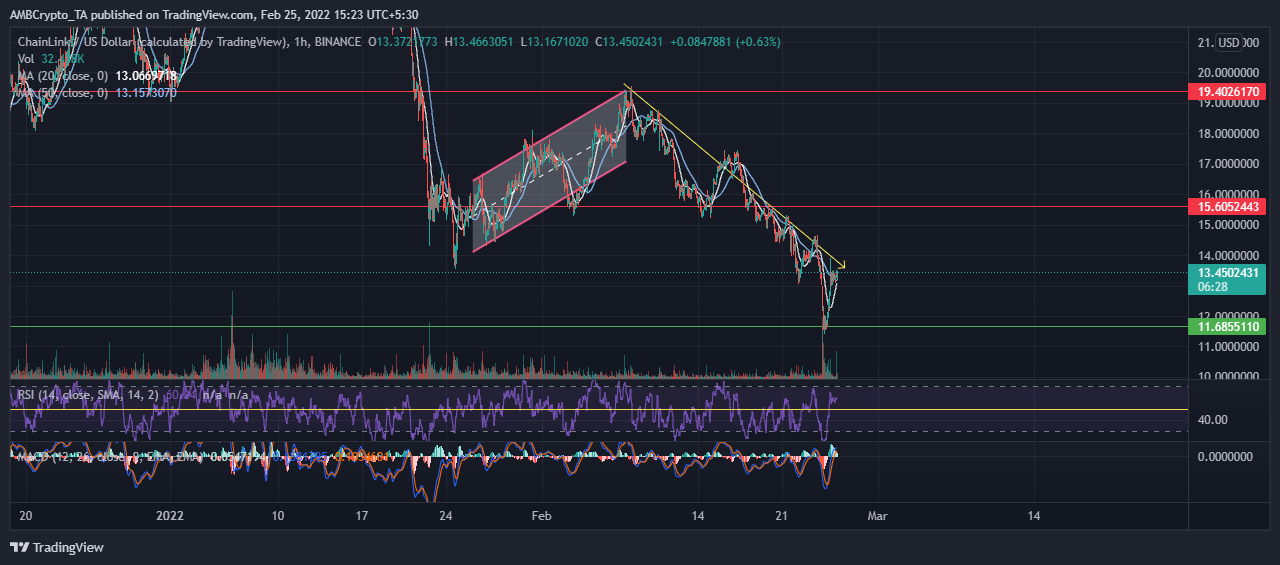
Chainlink (LINK) started stabilizing its position on the chart around 23 January when the altcoin came down to $13.63 following the December crash. LINK managed to move up from there, trading in an ascending channel and reached a resistance of $19.40 on 7 February.
Since then, the altcoin followed a downtrend. The LINK bears pushed the coin downward and owing to an intense sell off but the altcoin gained relief at $11.68 support level. However, over the past few hours, the market has recovered quite a lot. During press time, the alt traded at $13.53. The RSI hovered at 61.56, while the MACD projected a bullish crossover above the zero line.
Uniswap (UNI)
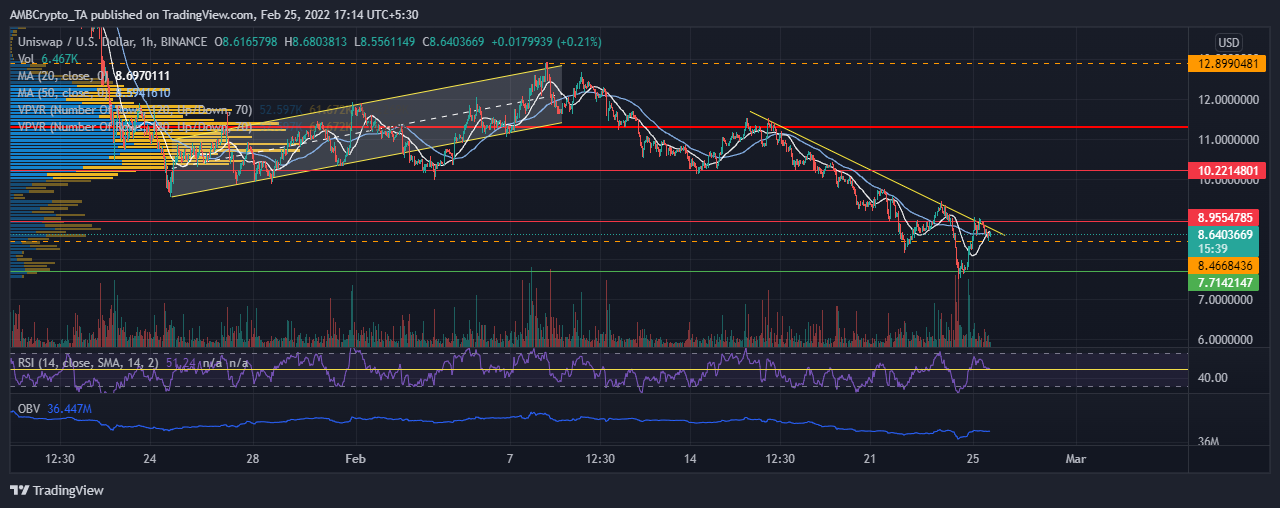
Even though Uniswap (UNI) was affected by the December crash, it did manage to pull back during mid December. However, towards the end of January, the bears took control and pushed the coin down south where it gained support at $9.71 on 24 January. Much like the aforementioned coins, UNI moved up since then and on 8 February reached resistance at $12.89 level.
UNI has been on a downtrend since then (yellow) marking consecutive lower highs. The alt found support at $8.46 level and bounced but before it could break the trendline resistance, it experienced a steep decline once again before recovering in the past few hours.
The RSI was at 49.72 and seemed to be declining again, while the OBV line, still hovering below the charts, moved sideways. A strong buying support would be necessary to break the trendline resistance