Shiba Inu: As selling pressures intensifies in SHIB, here’s how far it can fall

Disclaimer: The findings of the following analysis are the sole opinions of the writer and should not be considered investment advice.
Bitcoin has been weakly bouncing from the $38k support level, and on the previous day, it dropped decisively beneath this mark. This did not bode well for Shiba Inu bulls. SHIB has already been on a steady downtrend since February. Further losses appeared likely for Shiba Inu on the price charts.
SHIB- 12 Hour Chart
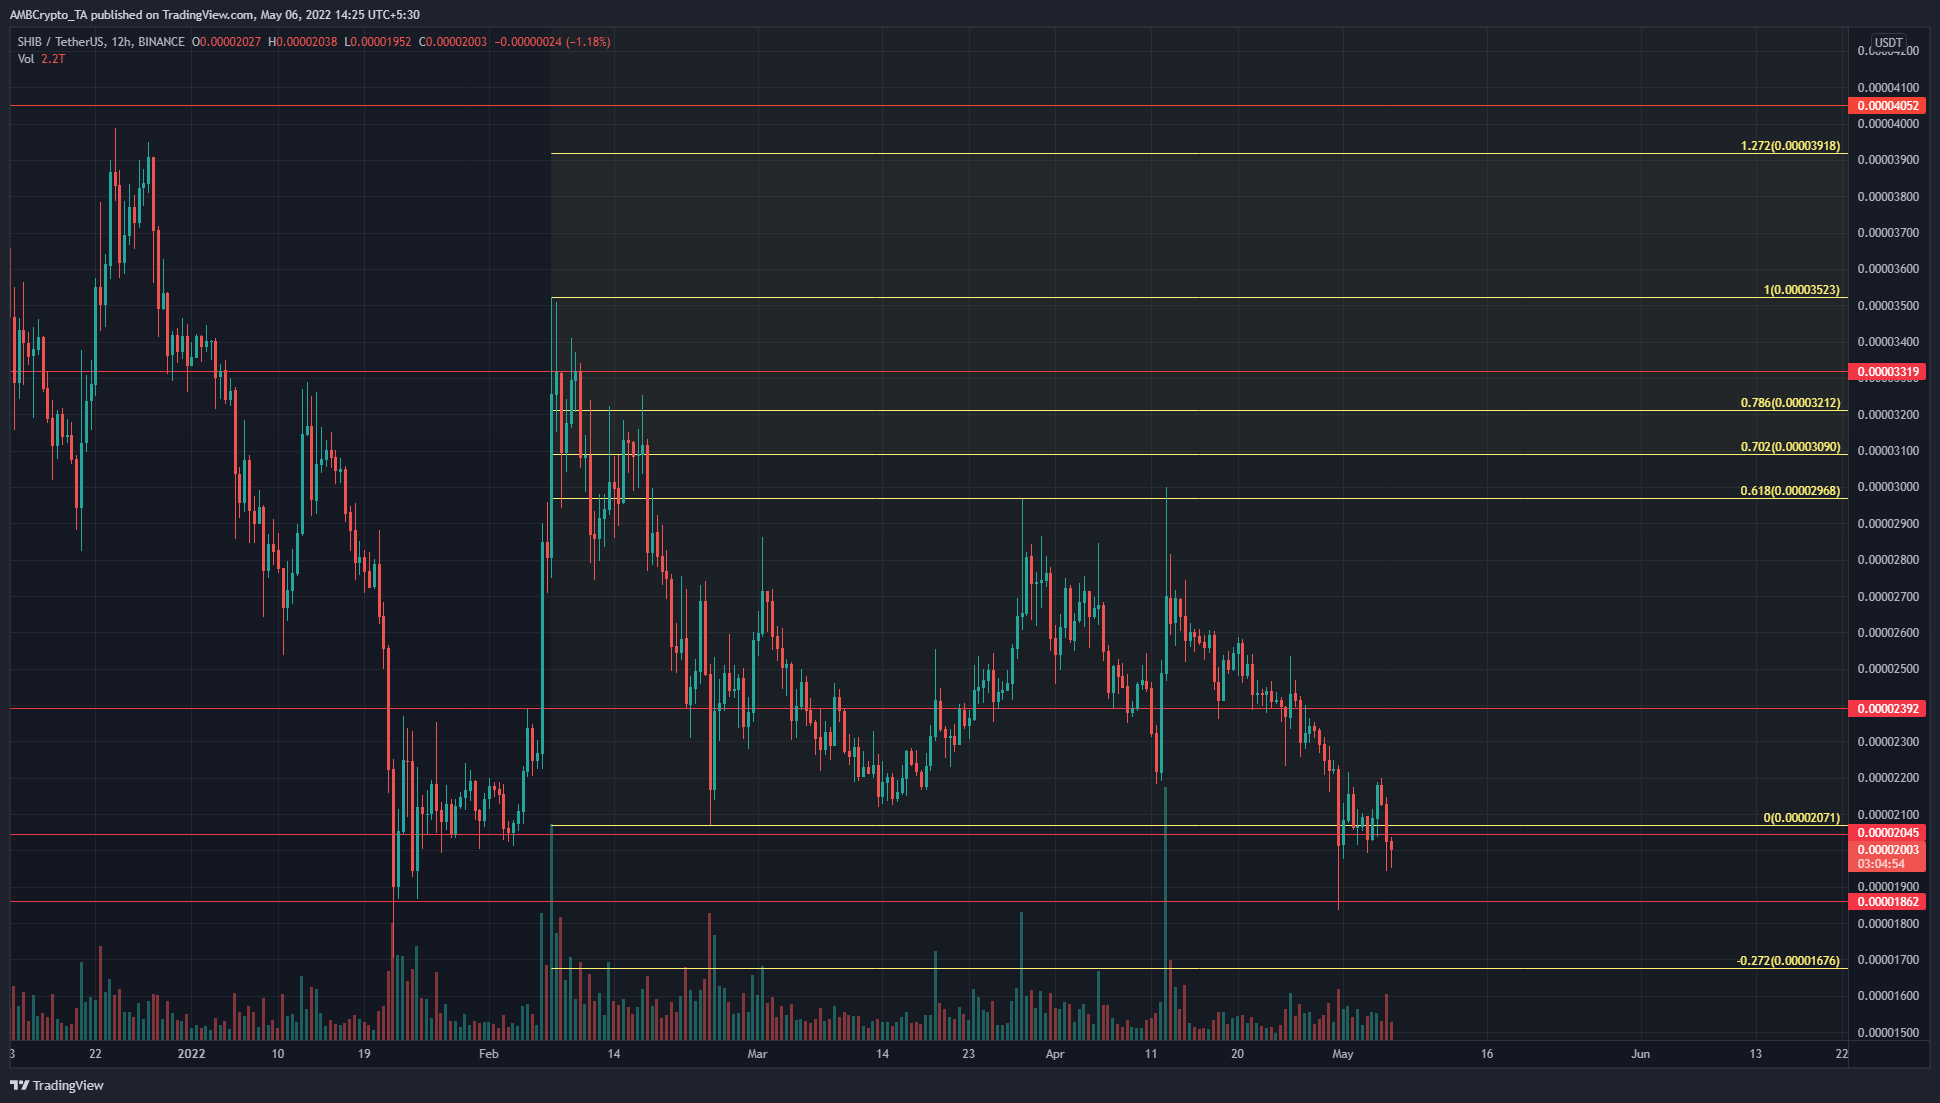
First things first, the price slipped beneath the $0.00002 level. This level had acted as support in late January and early February, and through March and April, the $0.0000022 level acted as support.
In the past two weeks, the price has slipped beneath both of these levels, with a candle wick down to the $0.0000186 level as well. Therefore, a further downside was likely. A set of Fibonacci retracement and extension levels (yellow) was plotted based on a SHIB drop in February.
The 61.8% retracement level has been tested in late March before steady losses in April. At press time, the price has fallen beneath the February swing low. This indicated that the downtrend could extend all the way to $0.0000167 in the weeks to come.
Rationale
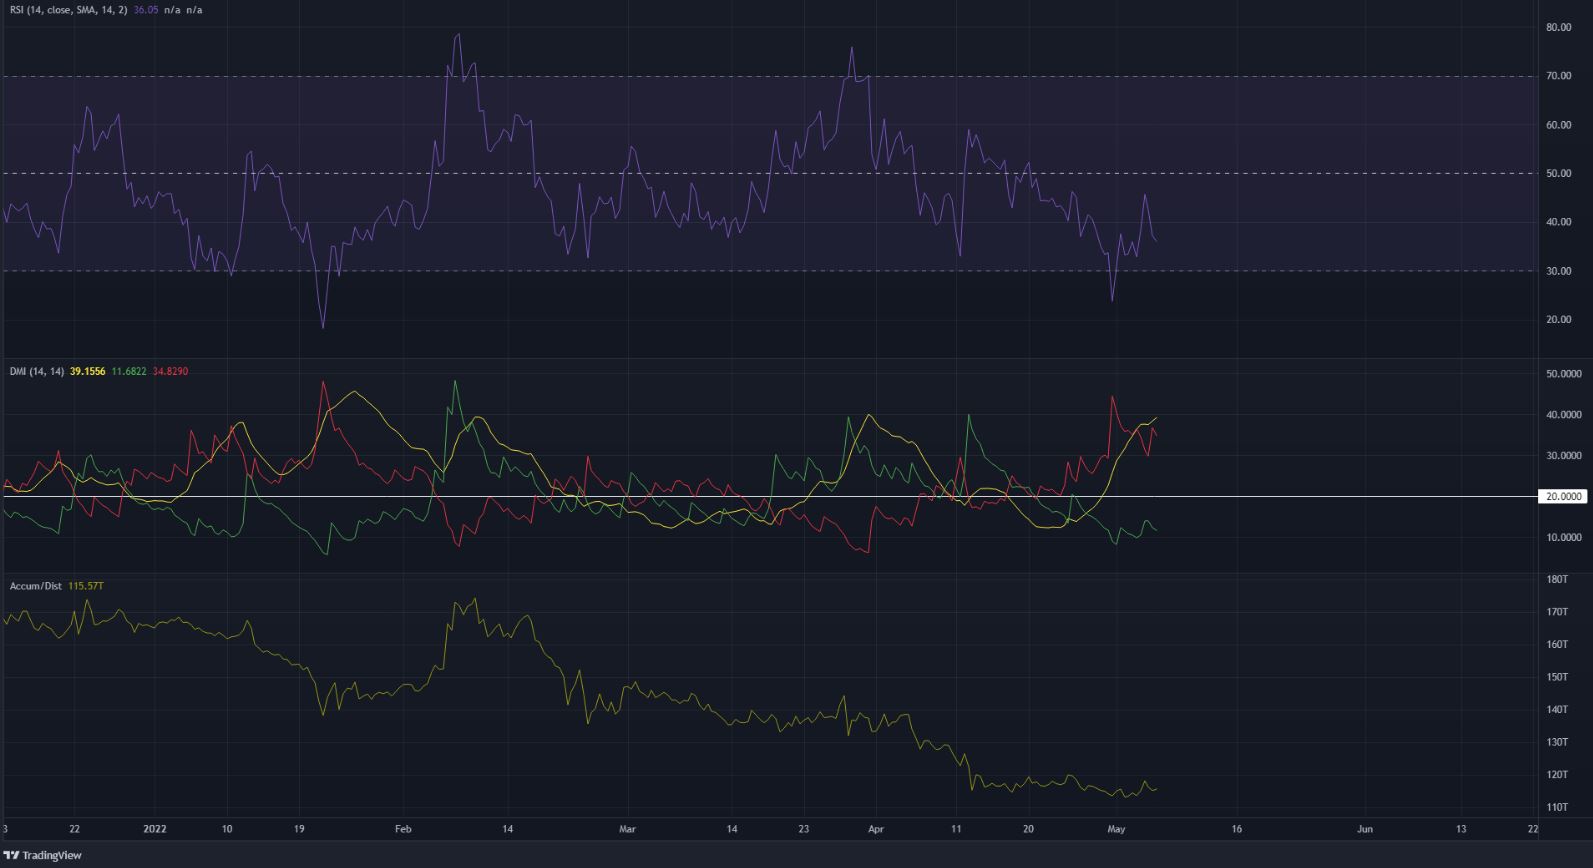
The indicators pointed toward a bearish bias as well. The RSI managed to climb above neutral 50 in March but fell back beneath the line in the second week of April. It continued to remain below neutral 50 and showed strong bearish momentum with a reading of 36.
The Directional Movement Index also showed an ongoing bearish trend of significance. Both the ADX (yellow) and the -DI (red) have been above the 20 mark for some time now. Alongside these bearish developments, the A/D continued to slide lower to show that sellers have the upper hand.
Conclusion
The price action has been strongly bearish in the past month, and the two rejections at the 61.8% retracement level are quite important indications that SHIB could drop below $0.00002 and toward $0.00016. The technical indicators also unanimously signaled strong selling pressure.