Shiba Inu: Bearish lingo or bingo? Here’s what’s in store for SHIB holders

Disclaimer: The findings of the following analysis are the sole opinions of the writer and should not be considered investment advice
Shiba Inu is ranked #15 on CoinMarketCap after taking a 25% hit to its value as an asset in the past week. The losses that the asset is posting on the charts are likely to continue in the days to come, as the market structure was bearish and sellers dominant. There were some notable support levels where SHIB could see a bounce, but they were quite a way further south. Will the price descend that far, or can bulls fight back?
SHIB- 2 Hour Chart
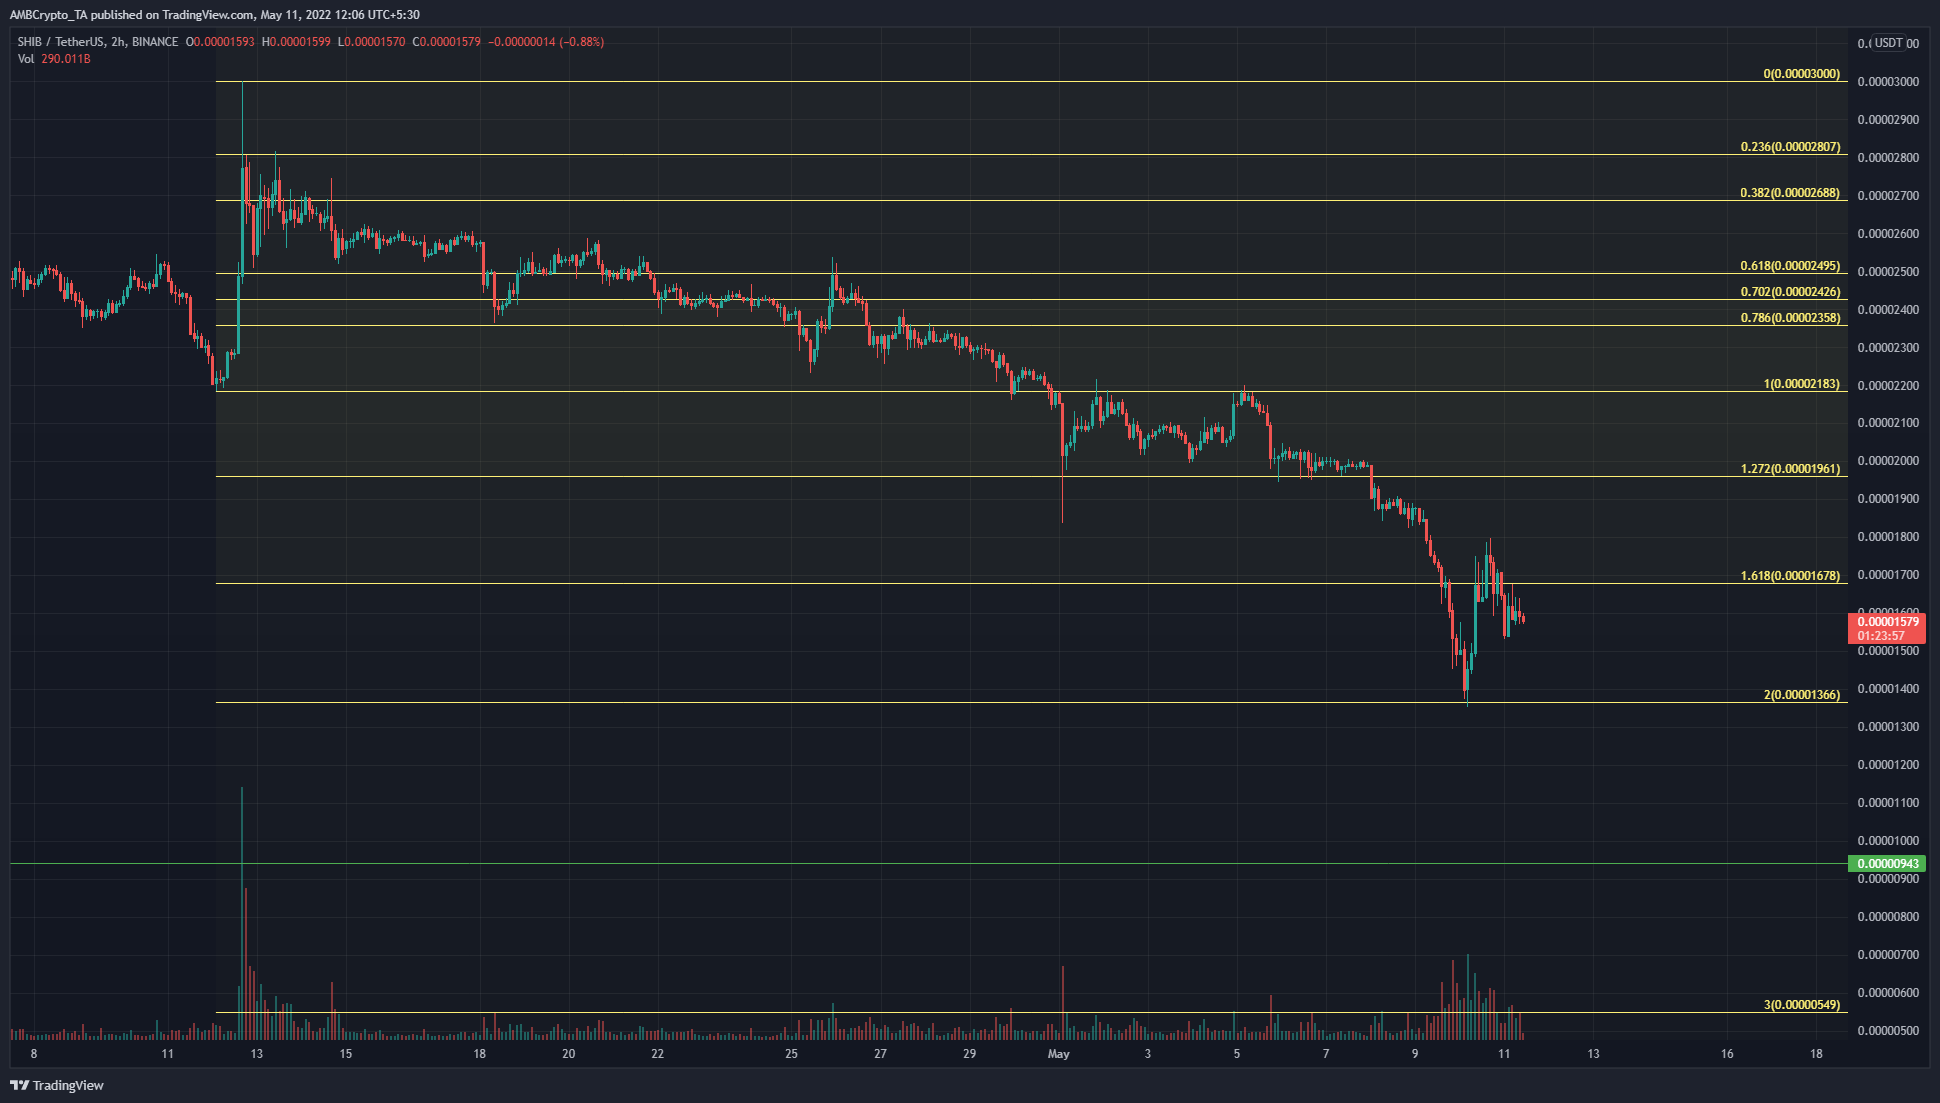
A set of Fibonacci retracement and extension levels (yellow) were plotted based on a SHIB move up from $0.00002183 to $0.00003 in mid-April. Since this move upward, at that time, appeared to break the market structure on the lower timeframes and flip it to bullish, it was expected that the 61.8% and 78.6% retracement levels will hold as support.
As April marched on, these levels were broken as support, and SHIB retraced 100% of the move upward and continued to fall. At press time, the 200% level offered some temporary respite. Further lower down the charts, the $0.0000094 and $0.0000054 levels are expected to serve as support in the days to come.
Rationale
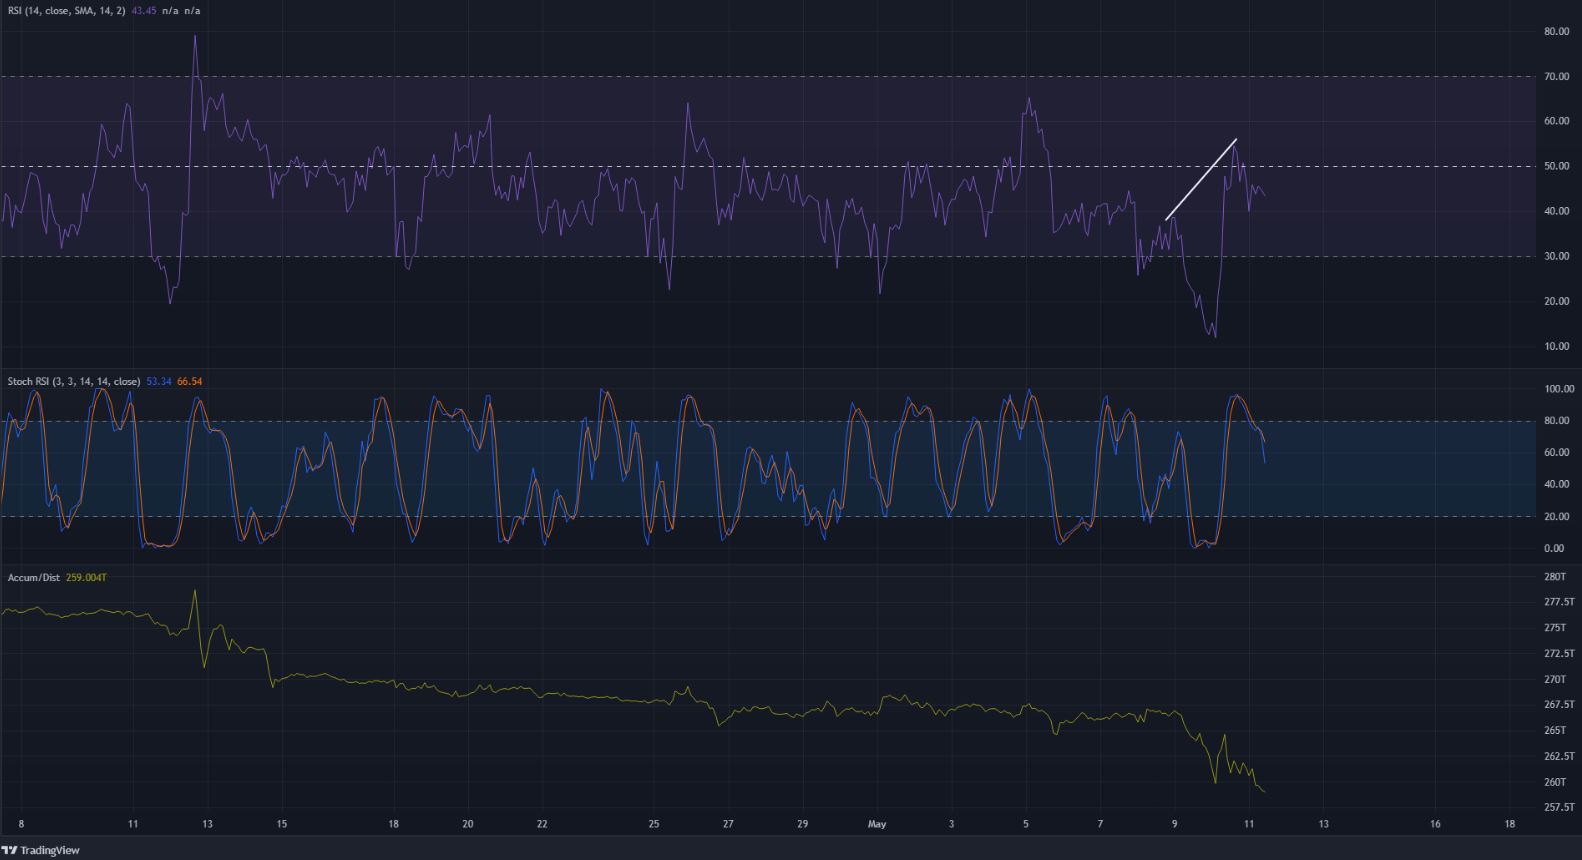
Will SHIB see another move downward? A fall from where SHIB was trading at press time, to the $0.0000094 mark represents a 40% fall. The RSI on the two-hour chart was unable to climb past neutral 50 and formed a bearish divergence in doing so. The RSI made a higher high while the price dropped lower, and such a development indicates the continuation of a bearish trend.
The Stochastic RSI also formed a bearish crossover above 80 and fell in recent hours. The A/D was on a downtrend as well, to show pronounced selling in the markets.
Conclusion
If SHIB closes a session below $0.0000136, it would be likely to head toward the support level lower on the charts. In such a scenario, opening a short position can be considered. Alternatively, a more risky venture would be to begin to build a Shiba Inu short position over the next few hours, with the stop-loss set just above the 161.8% extension level at the $0.0000168 mark.