Shiba Inu, Chainlink, EOS Price Analysis: 06 February

As the bulls endeavored to oppose the long-term bearish tendencies in the market, Chainlink and EOS continued their up-channel oscillation. Chainlink flashed mixed near-term signals while EOS flashed a bullish bias.
On the other hand, Shiba Inu’s bears attempted to snap the $0.00002233-level while the bulls defended 59-mark RSI support.
Shiba Inu (SHIB)
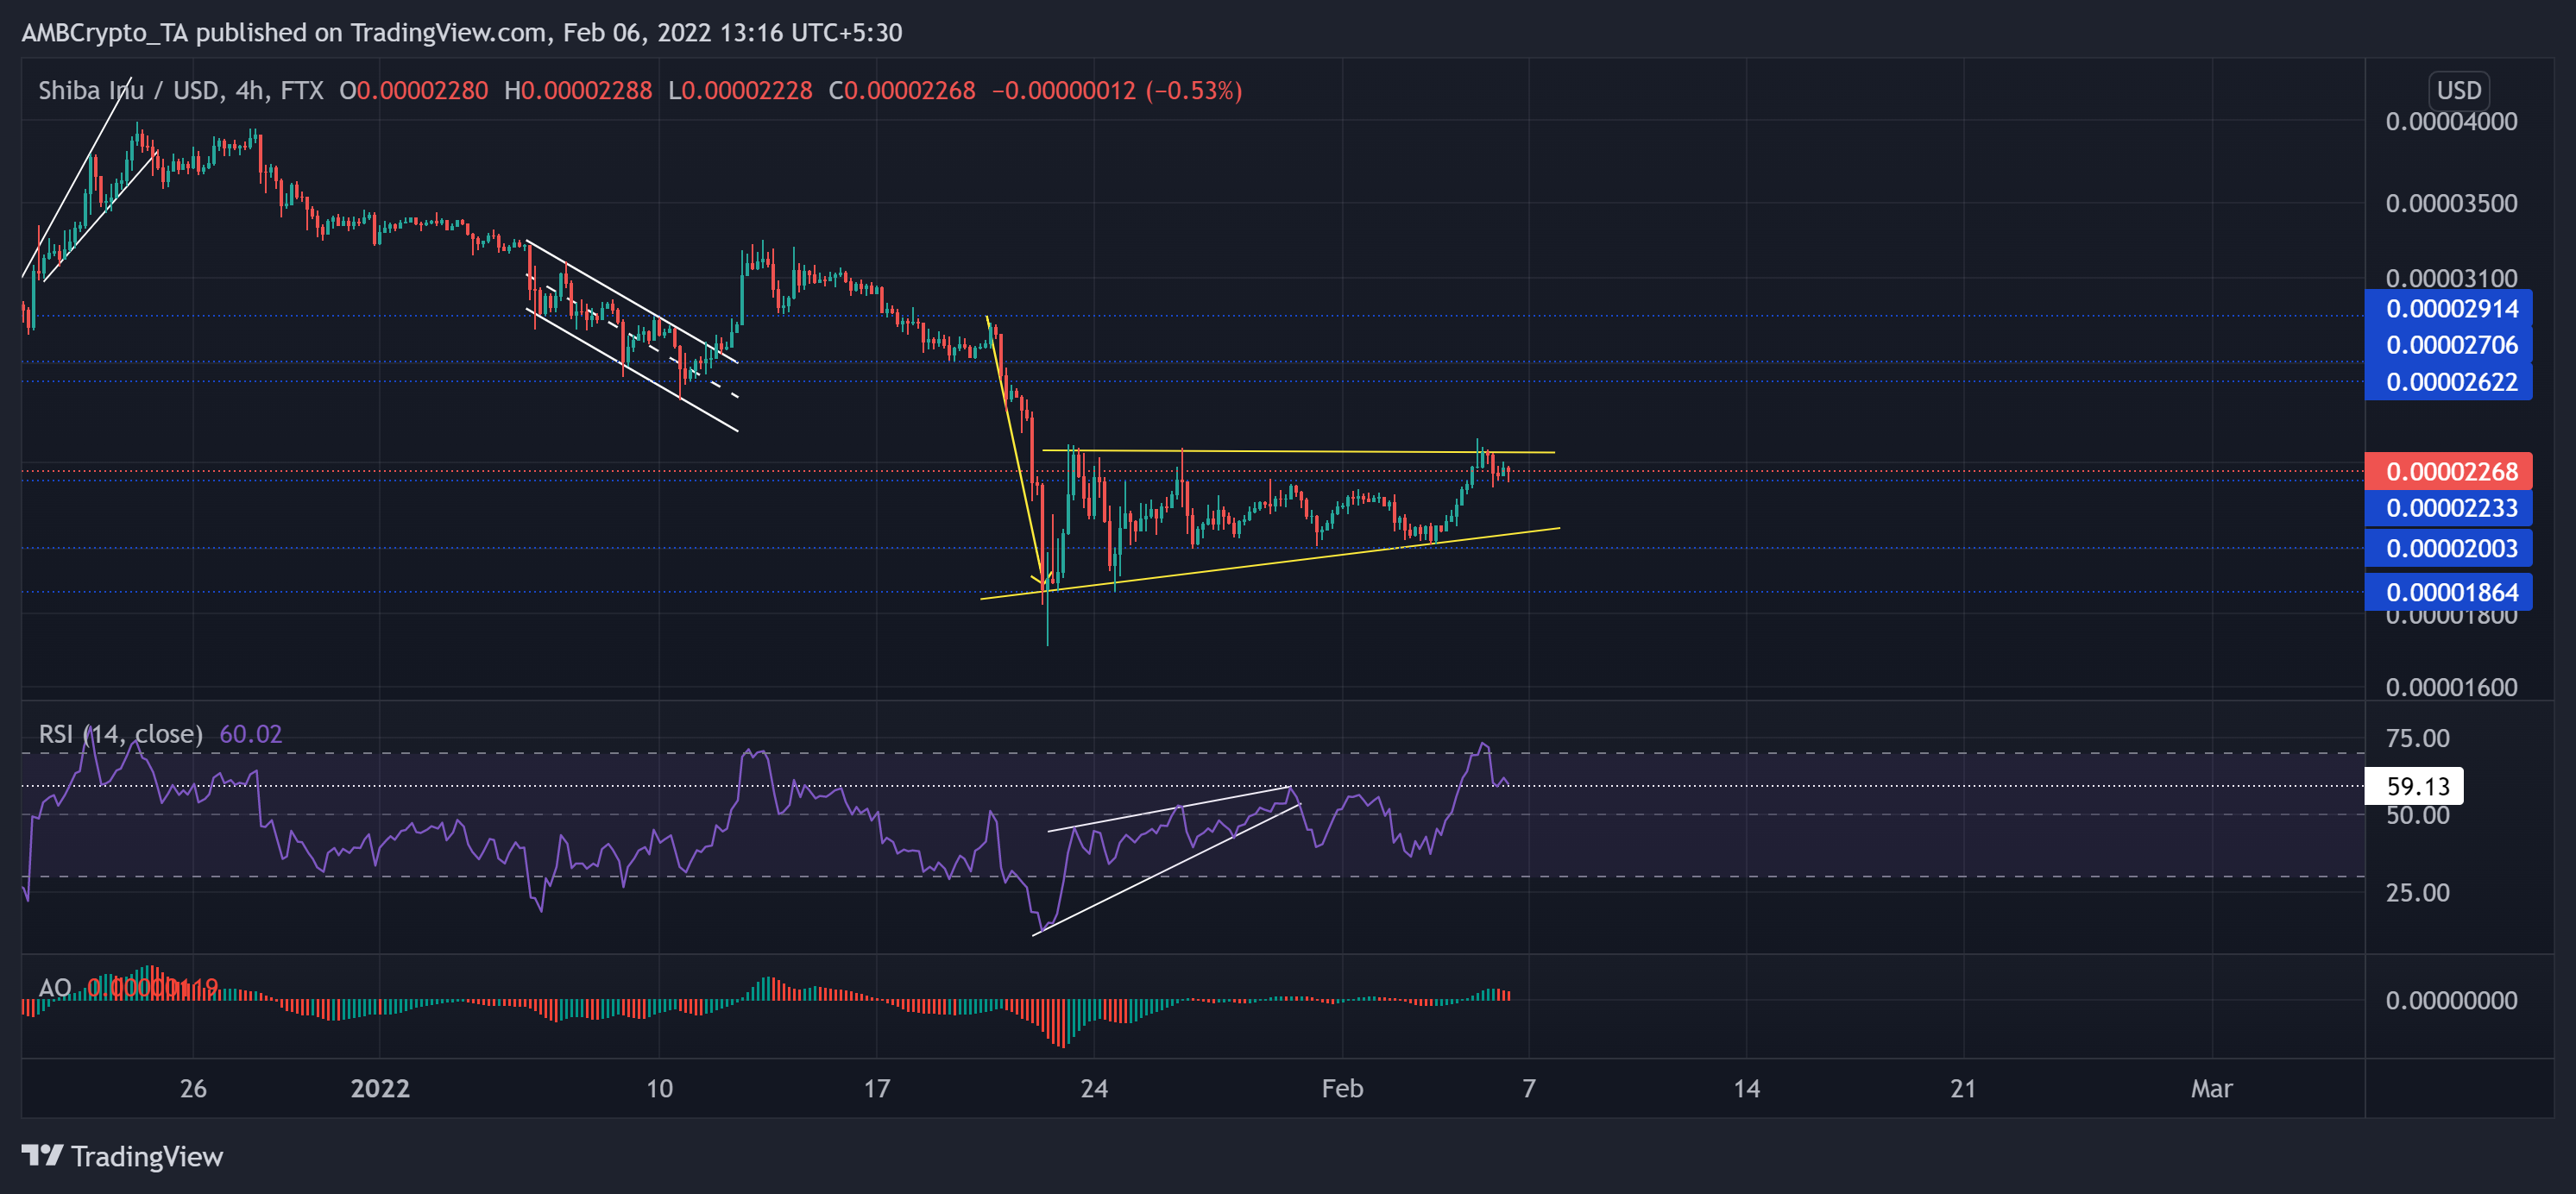
As the bulls failed to defend the $0.00002914-level, SHIB swiftly declined and lost 58.6% of its value (from 27 December). As a result, it touched its 15-week low on 22 January. Then, it saw a reversal after the buyers stepped in at the $0.00001864-level.
The meme coin witnessed a bearish pennant on its 4-hour chart over the past two weeks. Interestingly, the bulls reclaimed the $0.000022-level support in the last two days after noting over 19% gains. The immediate resistance continued to stand at the upper trendline of the pennant.
At press time, SHIB traded at $0.00002268. After a 30 point surge in two days, the RSI pulled back from the overbought territory in the last 24 hours. Thus, it tested the 59-mark while the bullish influence decreased. On top of it, the AO confirmed the decreasing buying influence as it approached its midline.
Chainlink (LINK)
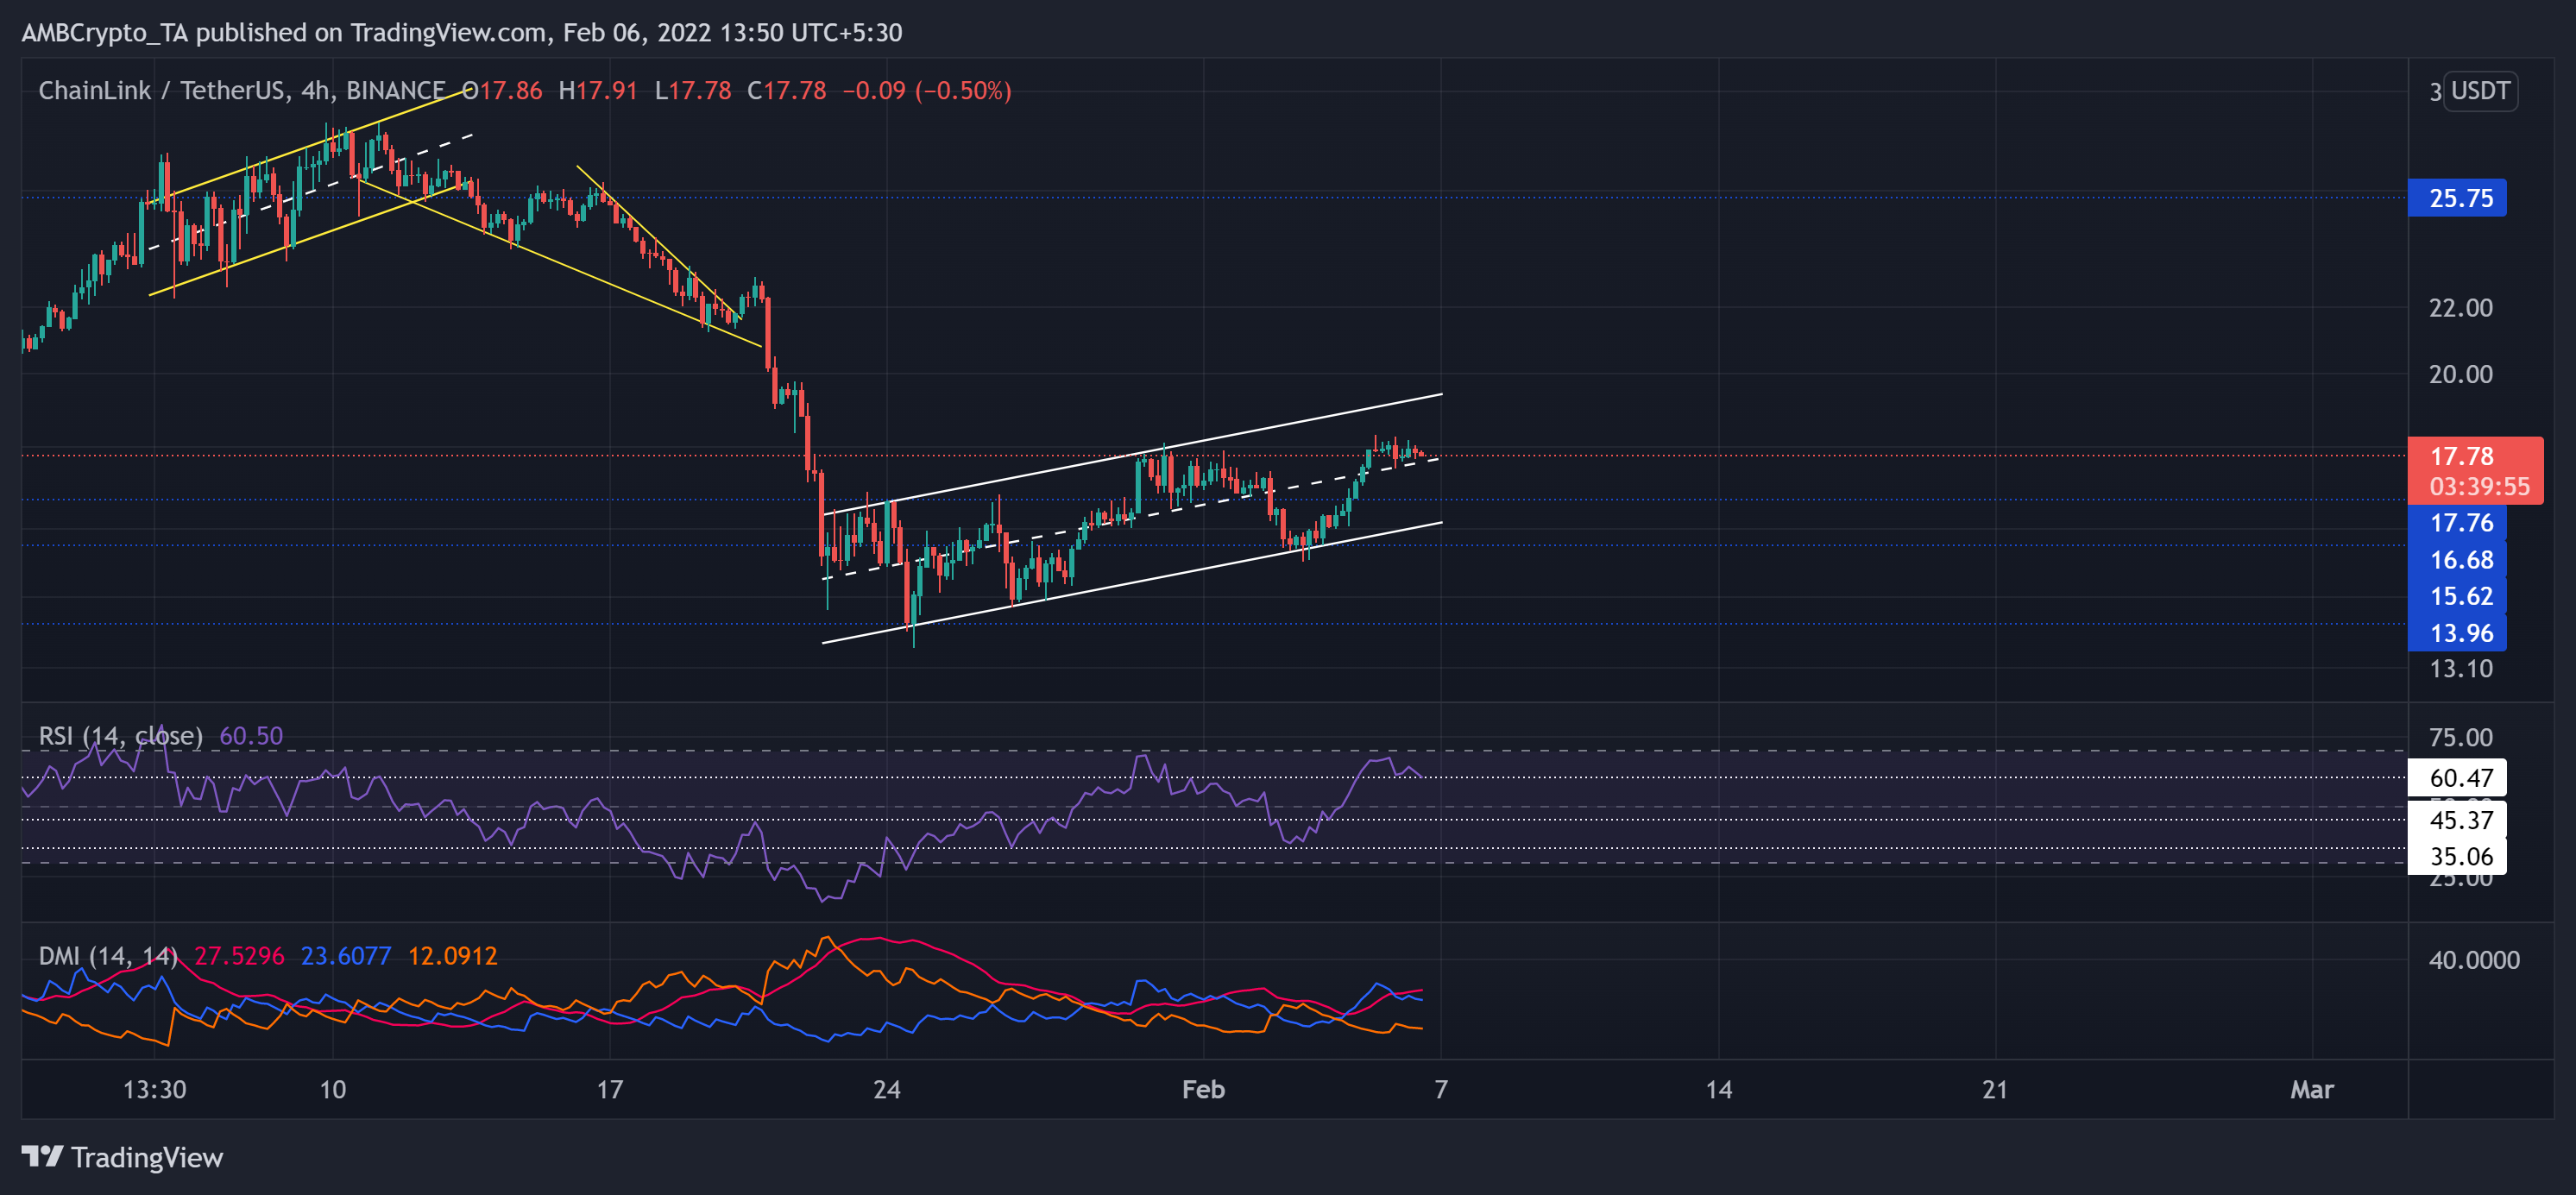
The buyers lost their vigor after LINK broke down from the up-channel (yellow). Thus, LINK plunged by 53.09% (from 11 January) to hit its six-month low on 24 January. However, the bulls finally showed up at the $13.96-mark as the alt recorded a 34.28% recovery later.
As a result, LINK pictured an ascending channel (white) on its 4-hour chart. Over the past week, the bulls have struggled to find a sustained close above the $17.76-level. Now, any reversals from here would find a floor at the $16.68-mark.
At press time, the alt traded at $17.78. After poking the 67-level on 5 February, the RSI dived to test its immediate support. Any fall below the 60-mark could propel a further downfall. Besides, with the +DI looking north, LINK painted mixed signals. Furthermore, the ADX (directional trend) was extremely weak.
EOS

The recent down-channel (white) breakout quickly reversed due to the broader sell-off on 21 January. As a result, EOS marked a 30.41% decline and touched its 22-month low on 24 January.
Since then, the alt has seen an up-channel (green) 25.5% recovery in the last 13 days. EOS noted over 13% gains in just two days before reversing from the upper trendline of the up-channel. The immediate resistance continued to stand at the upper trendline. Any retracements would find support near the 20 SMA (red).
At press time, EOS was trading above its 20-50 SMA at $2.5. The bullish RSI saw impressive gains and found a sustainable close above the 61-mark.