This is where these factors affecting Bitcoin’s price movements will take it

Bitcoin took quite a ride from its all-time high of over $69,000 to its recent low of $34,000. This has given way to the million-dollar question – What is affecting Bitcoin’s price movements?
Well, various interpretations are afloat. However, it’s important to note that a wide range of factors from macro-economic conditions to on-chain metrics have been influencing the king coin.
Walking down the macro-financial factors
While BTC’s move in November looked like a fairy tale, many failed to notice that macro conditions have been dominating the short-term outlook for crypto-markets. Starting with the Omicron Variant, The Fed’s outlook as inflation grew – A couple of global factors have been affecting the price as a whole.
Interestingly, U.S. January’s underwhelming employment data released on 4 February helped Bitcoin push up to test the $40k-level as it signalled to the Federal Reserve that there is less inflation to take action on. Also, a potential conflict between Russia and Ukraine has been a major concern for crypto-investors across the globe.
These factors have led to Bitcoin’s increasing correlation across markets. In fact, Bitcoin’s correlation with the S&P 500 increased in January. This means that equities might be an area to watch when making price predictions for the number one digital asset. Particularly, Bitcoin and crypto broadly moved closer to risk-on assets such as tech stocks.
In this context, it is to be noted that traditional markets are going through a volatile earning season, and it is causing ripple effects across crypto. Besides the external factors, the price technicals seem to have interesting insights too.
What the technicals say
1 January saw bulls putting up a brave fight at $48,000. However, BTC bears took over to initiate a major sell-off. The price plummeted to find support at $43,357 on 20 January. Interestingly, the following week, the support turned into resistance as the bears took command.
Going forward, the price saw some consolidation within the range of $39,006 to $33,927.
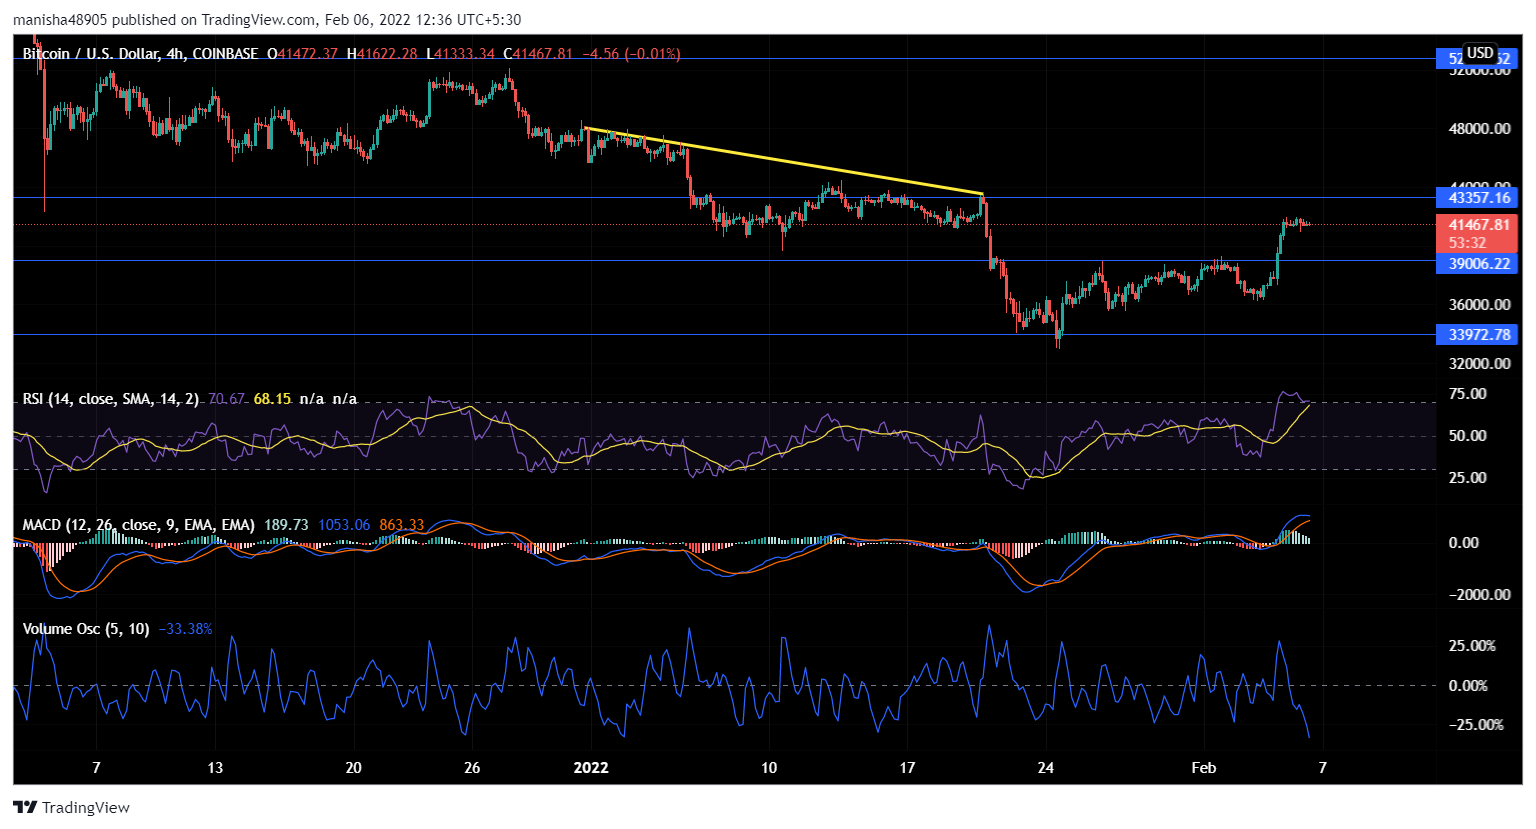
The RSI stood in the overbought category, at the time of writing. Thus, hinting at a trend reversal that might follow soon. MACD saw a bullish divergence post 4 February but a southward journey can’t be ruled out. However, Volume Oscillator flashed a major concern as it kept decreasing post 4 February on the back of a rise in price.
On the macro-scale, BTC appears to be siding with the bears. However, it’s important to note that post-January’s sell-off, BTC has been following the bullish momentum in the near term. Thanks to the on-chain metrics which generally have a direct effect on the BTC’s price trajectories.
The ‘on-chain’ bullish sign
On-chain data can help identify key price levels of entry and exits. Primarily, there are two main factors affecting Bitcoin’s internal metrics: The decreased supply available in exchanges and the “maturation” of holders based on the time that they have been holding.
Both of the same point to positive price action in the long run. Comparing the drawdowns experienced during May-July last year and the most recent ones, the exchanges net flows presented an interesting overview.
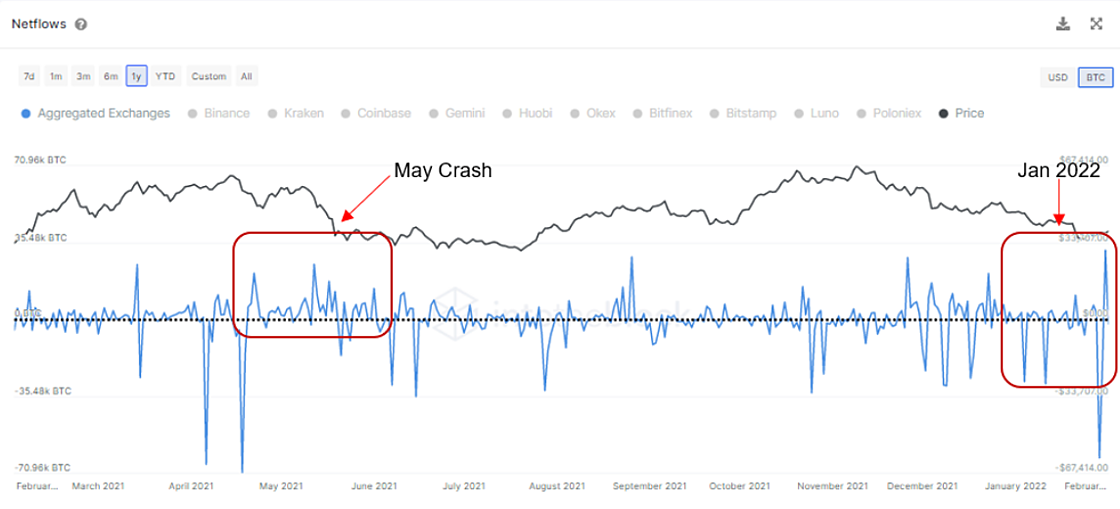
Between May and June of 2021, there were significant inflows of Bitcoin in exchanges. Thus, leading to a sell-off that happened during that period.
However, this time around, the net outflows increased, indicating that less Bitcoin is available to buy on exchanges as users tend to move these assets to cold storage or yield generating strategies. This hints at strong buying activity from BTC holders. Consequently, resulting in a potential supply shock as Bitcoin shifts from being held by short-term speculators to long-term investors. Notably, the negative supply shock here is fueling BTC’s move upwards.
Unlike the crash in May 2021, the percentage of BTC circulating supply that hasn’t been moved for at least 12 months is growing and approaching 60%. Unspent transaction outputs (UTXO) show the percentage holding BTC for over five years has hit a new record high too.
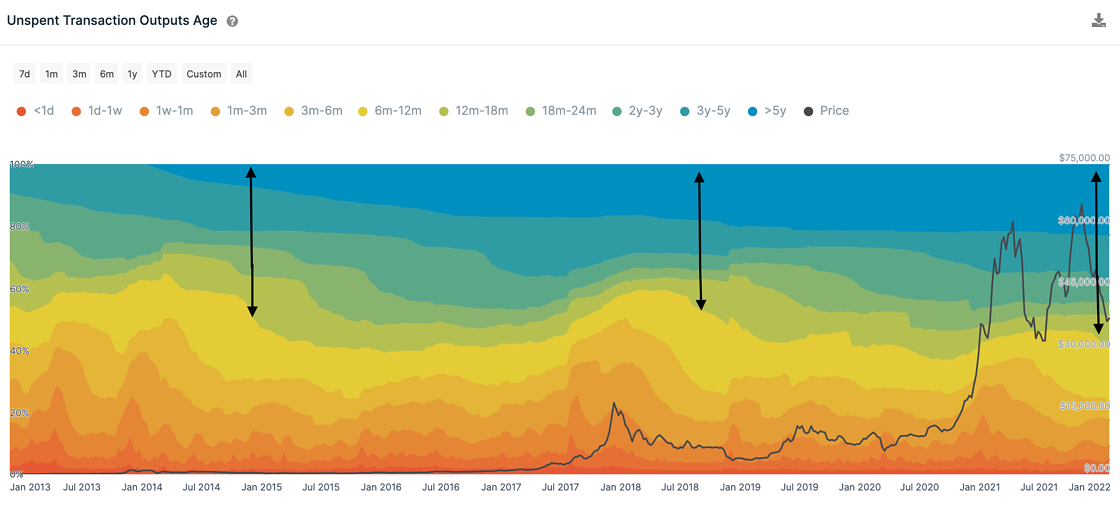
It shows coins are “maturing” as they shift over from speculators to holders with long-term convictions.
However, despite all the positive signs, it remains to be seen if Bitcoin will side with the bulls or if it faces strong resistance at the $42,000-mark.