Shiba Inu, Ethereum Classic, ApeCoin Price Analysis: 17 April

With Bitcoin retracing below its 4-hour 20/50/200 EMA, the overall market structure slightly favoured the selling viewpoint. Accordingly, ApeCoin saw a reversal from the $13-mark and broke out of its up-channel.
Ethereum Classic entered into a low volatility phase while flashing a weak trend. On the other hand, Shiba Inu pictured a slight bullish preference on its near-term technicals.
Shiba Inu (SHIB)

Do note that the price is multiplied by 1000 from here, for brevity.
On its way up from its mid-March lows, SHIB buyers attempted to drift the long-term outlook in their favor, but the bears upheld the nine-week trendline resistance (white, dashed).
The buyers did take charge of the long-term support from the $0.021-mark. Over the last five days, the meme token saw an over 24% growth that halted at its trendline resistance. Despite the recent pullback, the price swayed above the 20/50/200 EMA and displayed a bullish preference.
At press time, SHIB traded at $0.02572. Over the last few days, the RSI hovered around the midline and noted a slight bullish edge. Furthermore, the CMF revealed a bias favoring the sellers. But, recovery from its support would affirm a hidden bullish divergence with price.
Ethereum Classic (ETC)
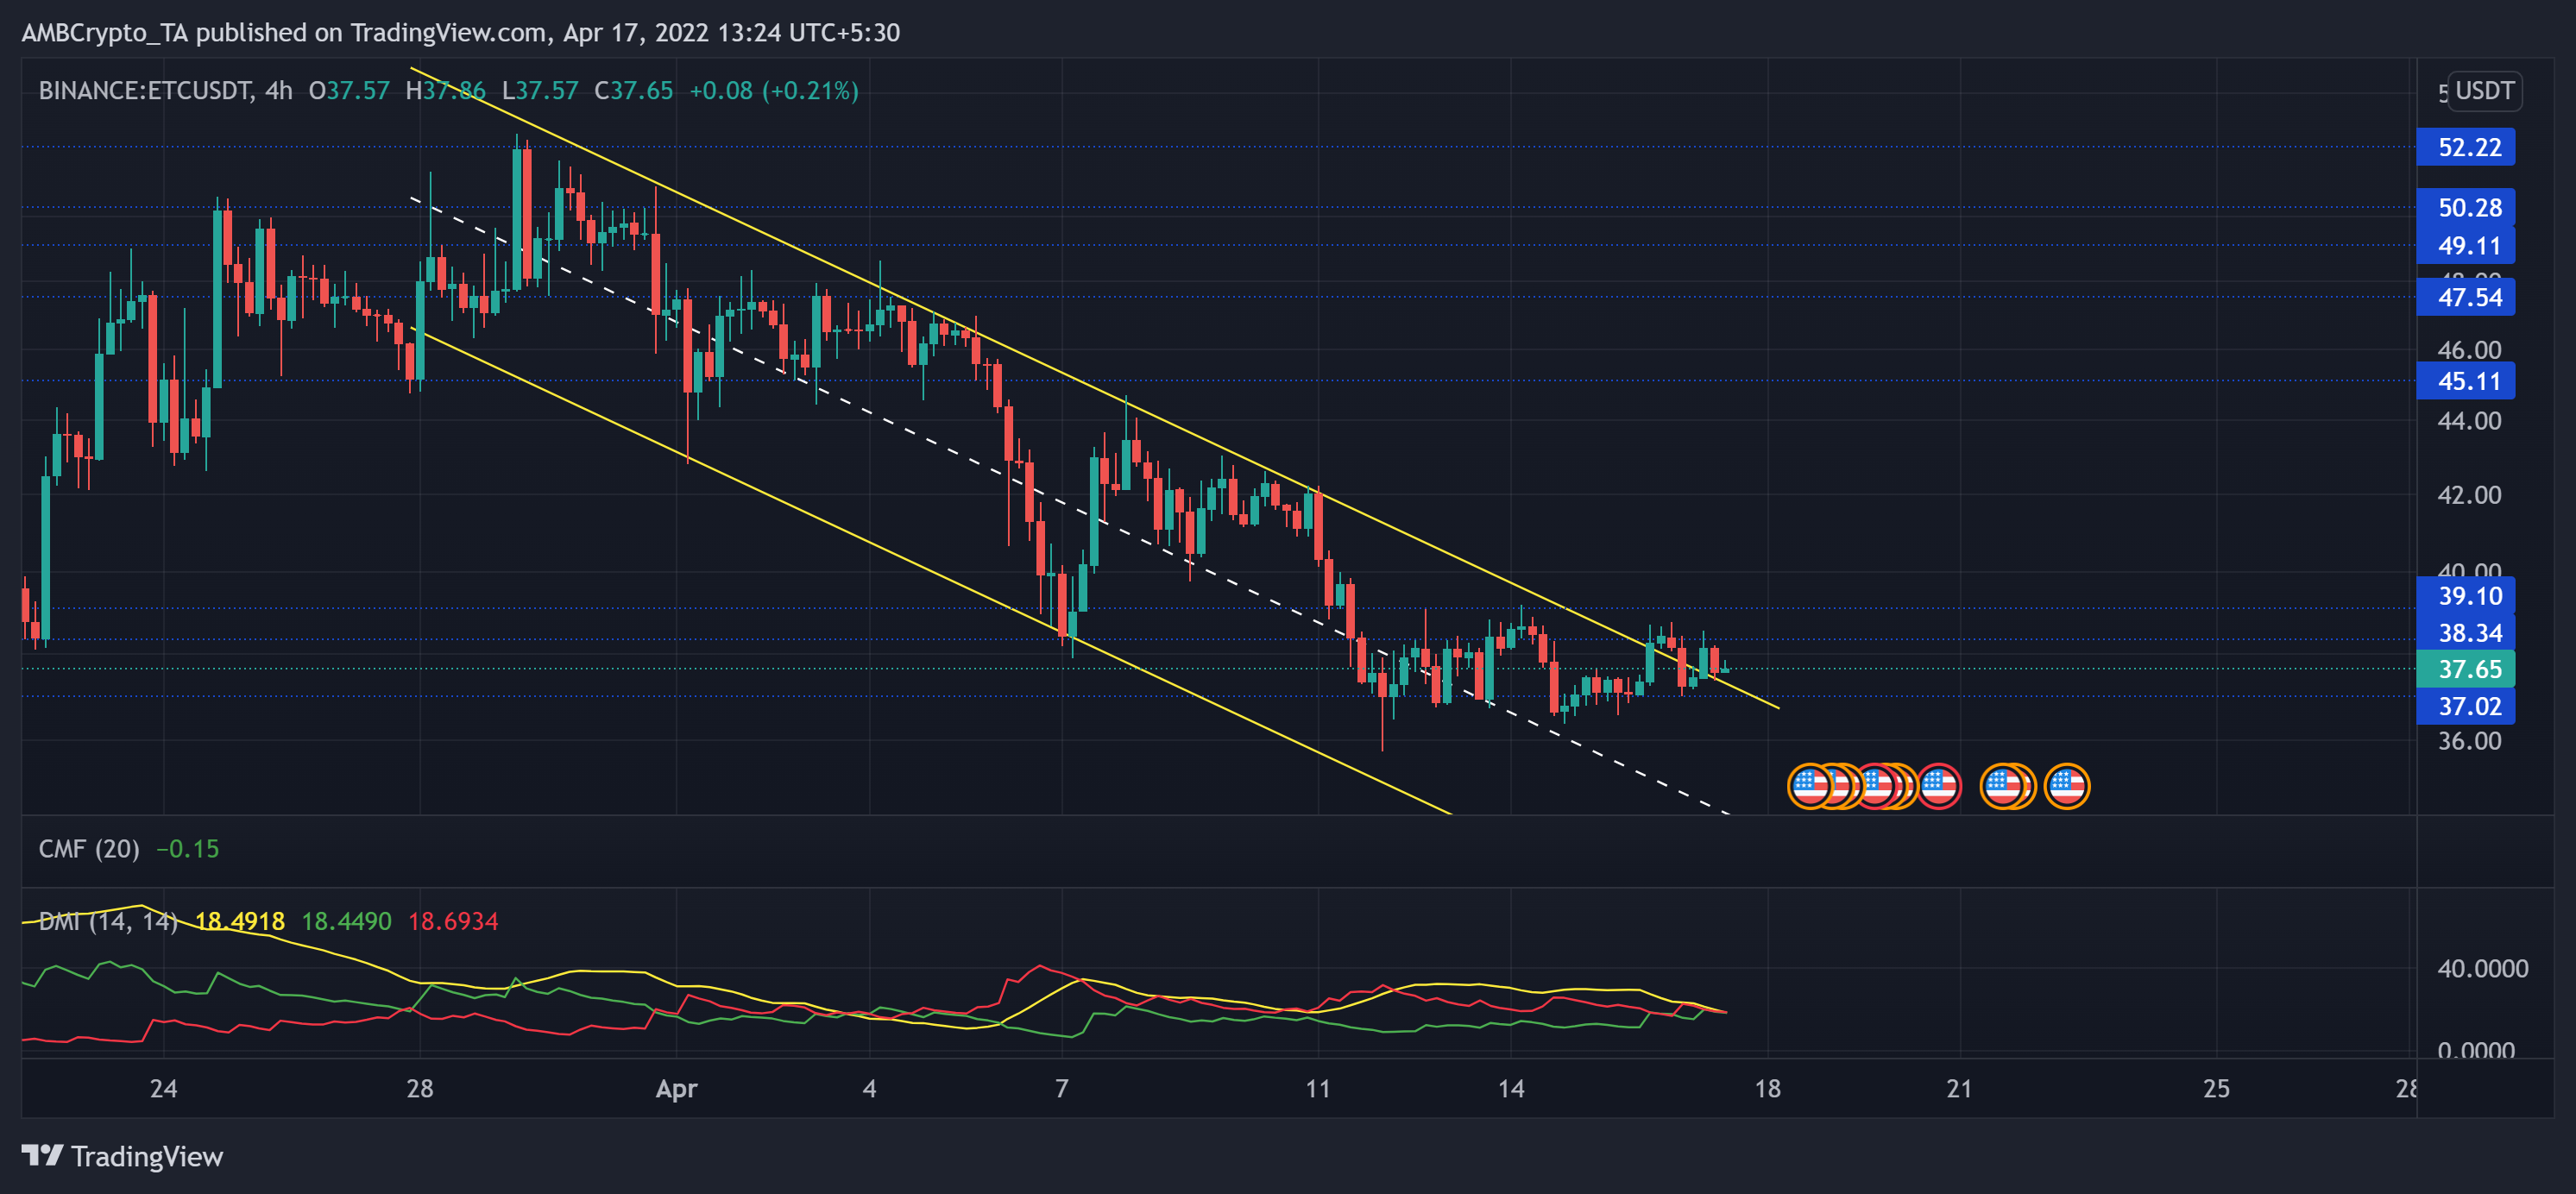
ETC lost more than 70% of its value from its September highs and touched its nine-month low on 22 January. Since then, the altcoin has seen an aggressive 78.3% recovery over the last three months.
As a result, it touched its four-month high on 29 March. Since then, ETC has steeply declined in a descending channel (yellow). With the $37-base intact, the buyers endeavored to find a sustainable break above the pattern.
At press time, ETC was trading at $37.65. The DMI refrained from giving an advantage to either side. To top it up, the ADX indicated a weak directional trend for ETC.
ApeCoin (APE)
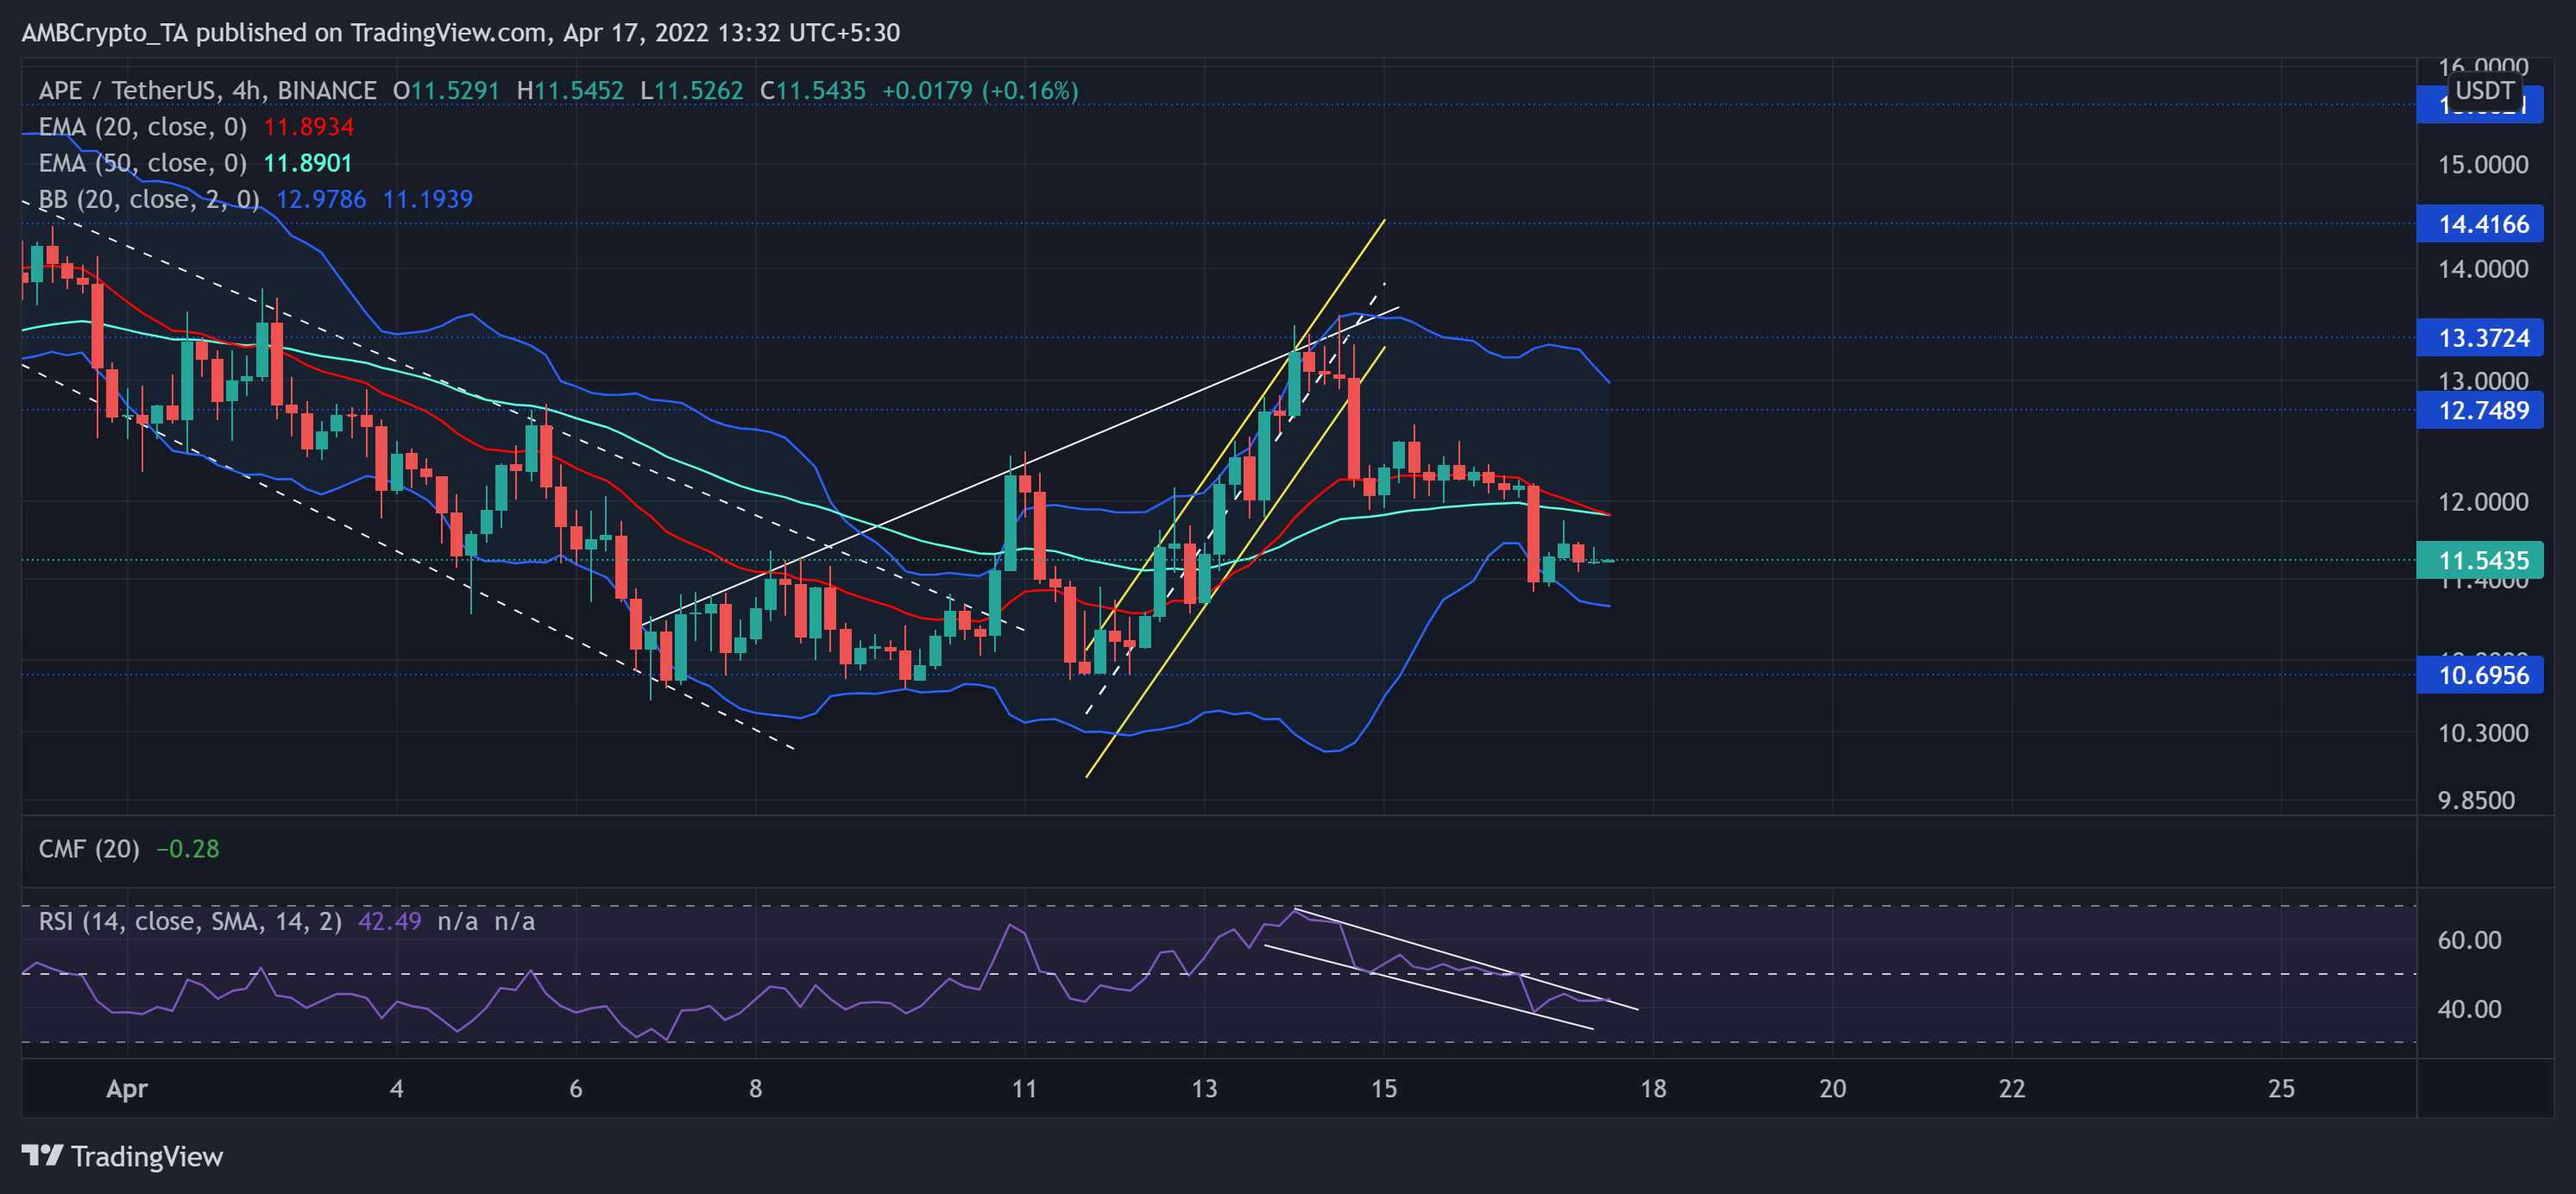
APE did quite well while recovering in an up-channel (yellow) on its 4-hour chart. Following its 30% 10-day plunge, buyers re-entered the market around the $10.6-mark and pulled the price up from its multi-week lows.
But with the $13-resistance standing sturdy, the sellers propelled a downswing below its 20 EMA (red) and 50 EMA (cyan). This fall led the price to keep testing the lower band of the Bollinger Bands while breaking into high volatility.
At press time, APE traded at $11.5435. The RSI devalued in a down-channel below the equilibrium. A close above its upper trendline would open up recovery gates towards the 50-mark.


