Disclaimer: The findings of the following analysis are the sole opinions of the writer and should not be taken as investment advice
Shiba Inu seems to have taken the crypto-community by storm. The month of October saw SHIB become a top-15 crypto after recording an astonishing ROI of 550% in just 30 days. On the charts, SHIB continued to rake in gains after a bullish pennant breakout last week.
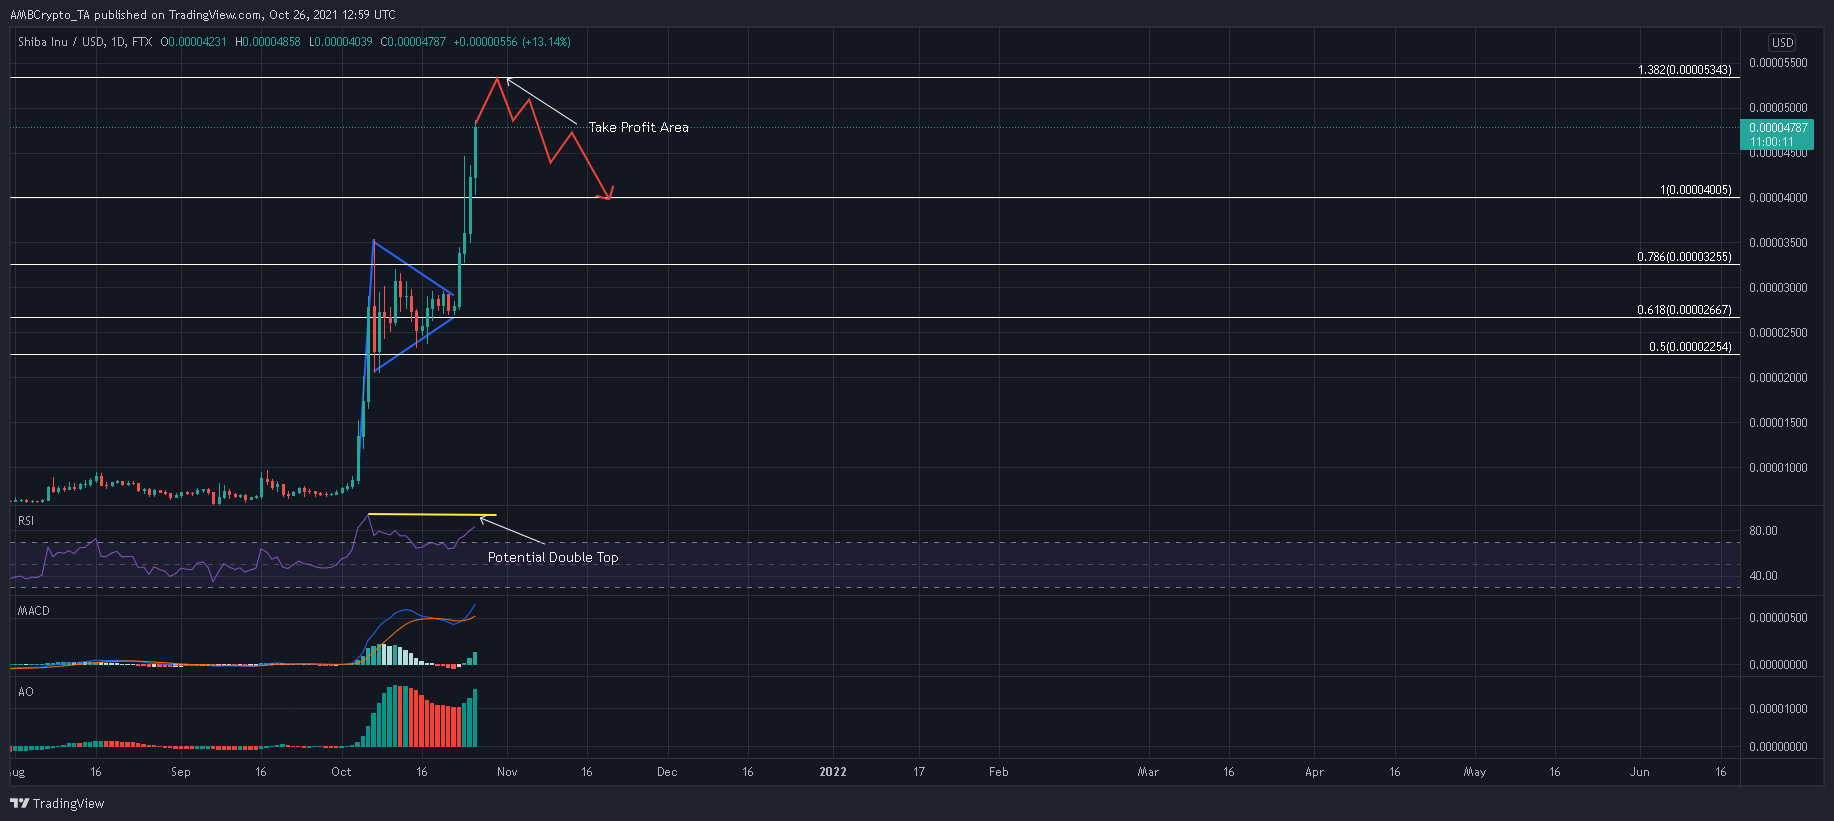
With each of the RSI, MACD, and Awesome Oscillator eager to best their previous peaks, SHIB seemed poised for an extension towards the 138.2% Fibonacci level. However, a retracement could set in if investors pull out before SHIB tags $0.00005343.
Shiba Inu Daily Chart
Source: SHIB/USD, TradingView
Shiba Inu continued its ascent after a bullish pennant began to take shape post the first week of October. Interestingly, an overbought RSI and bearish crossover on the MACD failed to counter an upwards breakout from the pattern.
With four successive green candlesticks now lining up on SHIB’s daily chart, sentiment seemed to be heavily in favor of the buying side. From here, SHIB has to register a further 11.5% hike to tag its 138.2% Fibonacci level, following which, the 161.8% ($0.00006169) and 200% ($0.00007507) Fibonacci levels would be targeted.
Even though SHIB’s RSI moved deeper into overbought territory, an extended hike can be expected as long as the index is able to best its previous peak. Same holds true for the MACD and Awesome Oscillator as well.
Should sellers react to the double top on each of these indicators, expect SHIB to fall just short of the 138.2% Fibonacci level. SHIB’s previous ATH at $0.0000400 would serve as crucial support during a correctional period.
Conclusion
Strong trading volumes across exchanges, coupled with bullish readings on the RSI, MACD, and Awesome Oscillator, could see SHIB test its 138.2% Fibonacci level over the coming days.
However, the aforementioned region would serve as a lucrative take-profit for investors. In case the indicators also weaken following a double top setup, expect SHIB to retrace to $0.0000400 before embarking on the next upcycle.