Shiba Inu is expected to pullback here before a bullish continuation

- A move above the near-term resistance and retest can be used to buy.
- A pullback to the bullish order block can also be awaited.
Shiba Inu faced some resistance at the $0.0000123 mark over the weekend. The open and close of the Monday trading session could set levels to watch out for over the coming week. Traders can wait for a pullback before entering long positions.
How much are 1, 10, or 100 SHIB worth
Two important support zones based on the 4-hour and daily timeframes were identified. Since both Bitcoin and Shiba Inu had a bullish bias, more upward momentum was expected.
Inefficiencies to the south have been filled but near-term resistance formed over the weekend
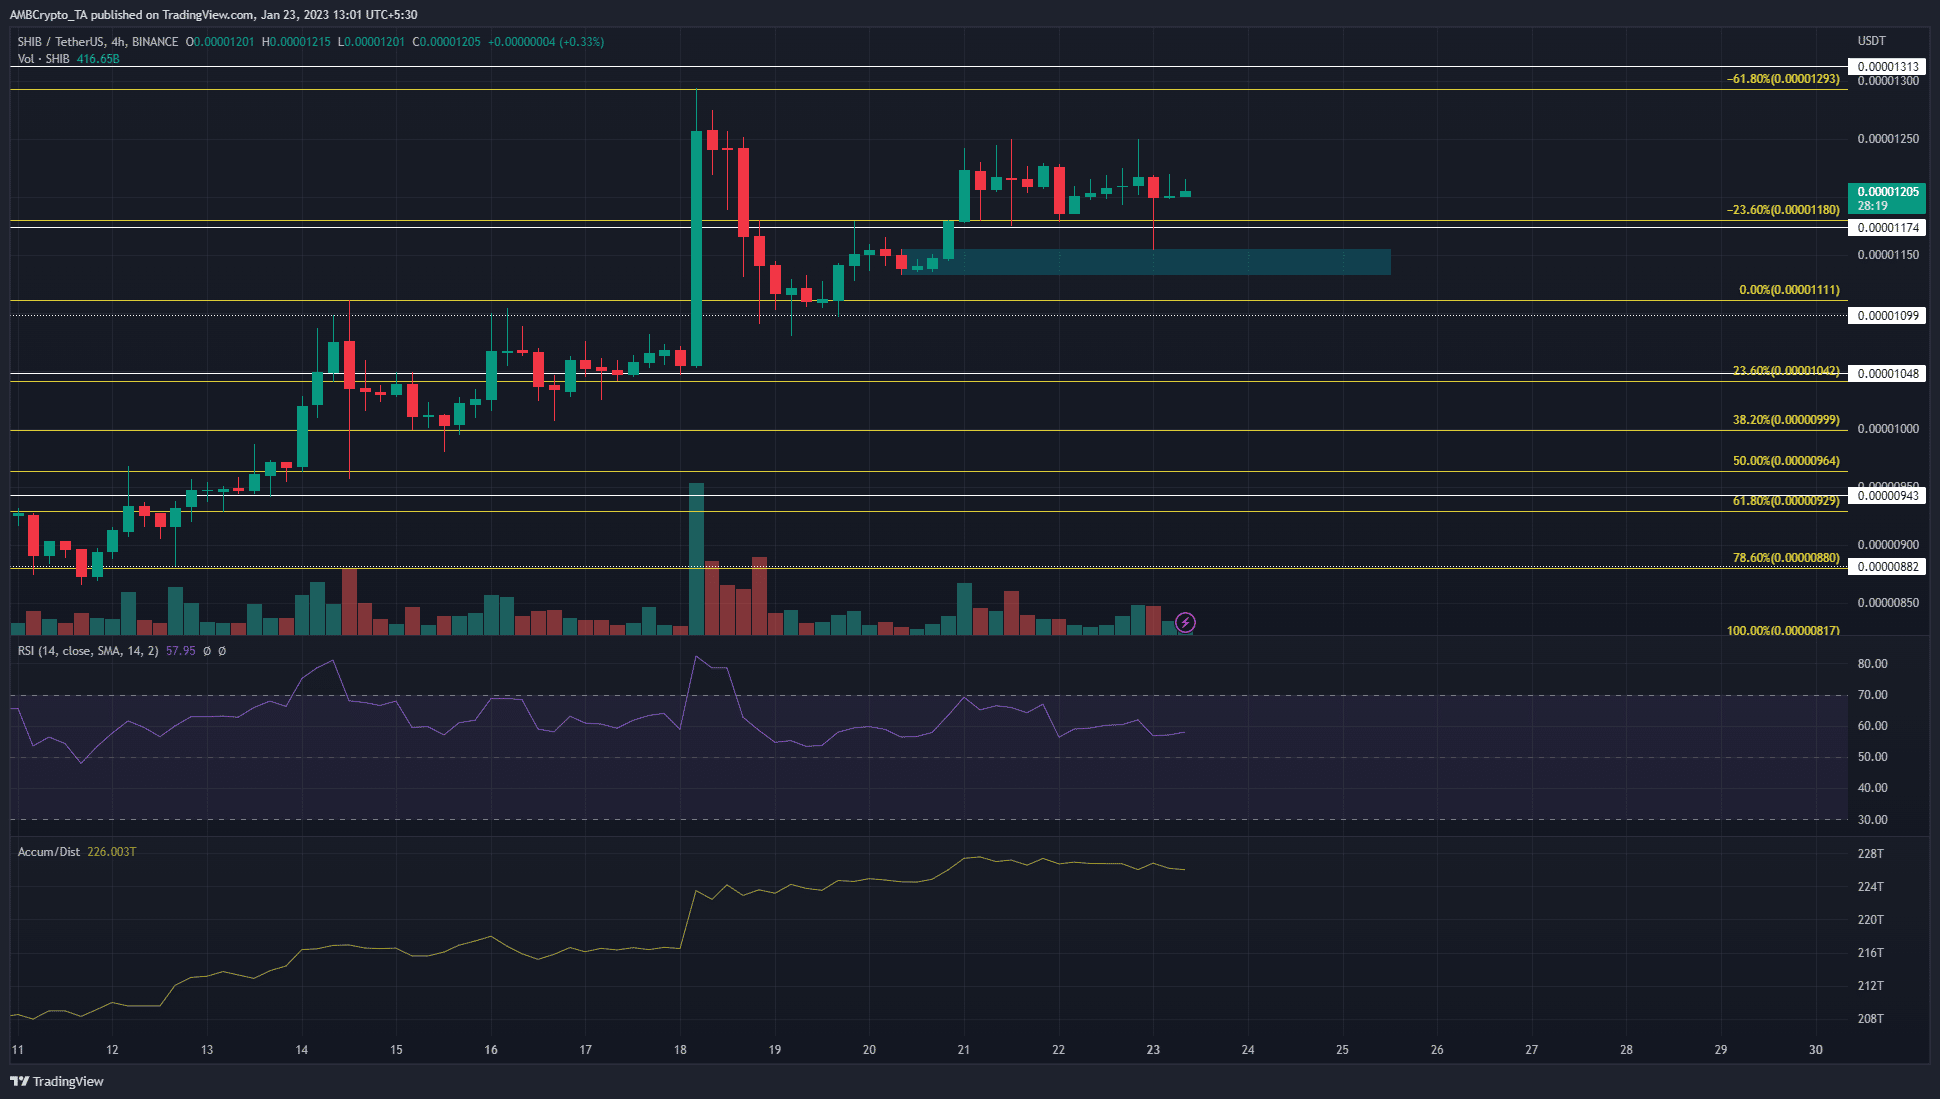
On January 18 and January 20, fair value gaps were seen on the 4-hour chart. Both of these imbalances have been filled. The first one extended from $0.0000107-$0.0000122, and the second from $0.0000115-$0.0000118.
The first was filled last week on the pullback, and the second was filled in recent hours of trading on a dip. Moreover, the bullish 4-hour order block (red box) was also revisited.
Read Shiba Inu’s Price Prediction 2023-24
This retest saw a sharp reaction of nearly 5% upward in the space of eight hours, which indicated the order block had some near-term significance. Over the weekend, Shiba Inu faced some resistance in the $0.0000123-$0.00001245 area.
The RSI dipped to 57.9, which showed bullish momentum but not as strongly as a few days ago. The A/D indicator ran flat to show buyers and sellers at an impasse.
In the next day or two, a retest of the bullish order block at $0.0000113-$0.0000115 can be used to buy SHIB with the stop-loss set near $0.0000109. A session close below the order block would invalidate the bullish idea. In such a scenario traders can expect a deeper dip to the $0.00001048 support level.
Open Interest dwindles to show discouraged bulls

Source: Coinalyze
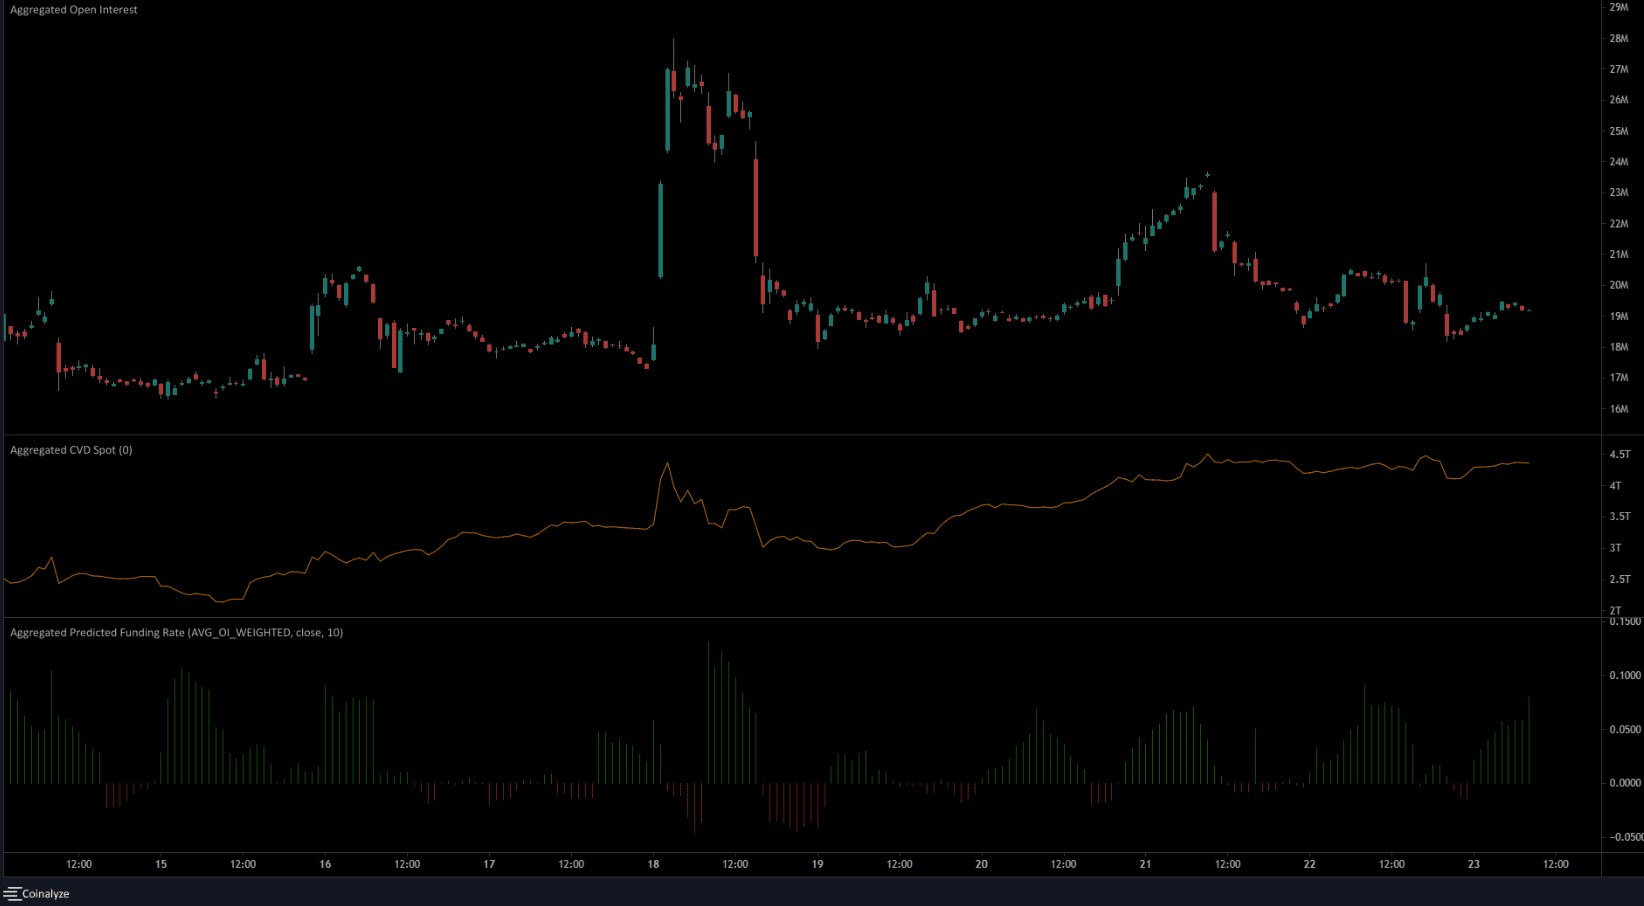
Over the weekend, the Open Interest slid lower while the price dawdled near resistance. This indicated speculators were sidelined and money did not flow into the market. Meanwhile, the spot CVD was also flat, mirroring the A/D line.
Together, they showed that buying pressure was not strong. However, from a technical perspective, the bias would remain bullish until $0.0000113 is broken. Even then, the $0.00001048 can act as support. The predicted funding rate was positive showing market participants held a bullish view as well.


