Shiba Inu, Litecoin, Loopring Price Analysis: 20 November

The market entered into a dynamic zone, wherein the bulls attempted to counter the extended correction phase. Thus, altcoins like Shiba Inu and Litecoin saw green candlesticks over the past 24 hours. The outlook remained bearish while the near-term technical indicators pointed at its decreasing influence.
On the flip side, Loopring flashed bullish indications but fell into a downturned after striking its ATH on 10 November.
Shiba Inu (SHIB)
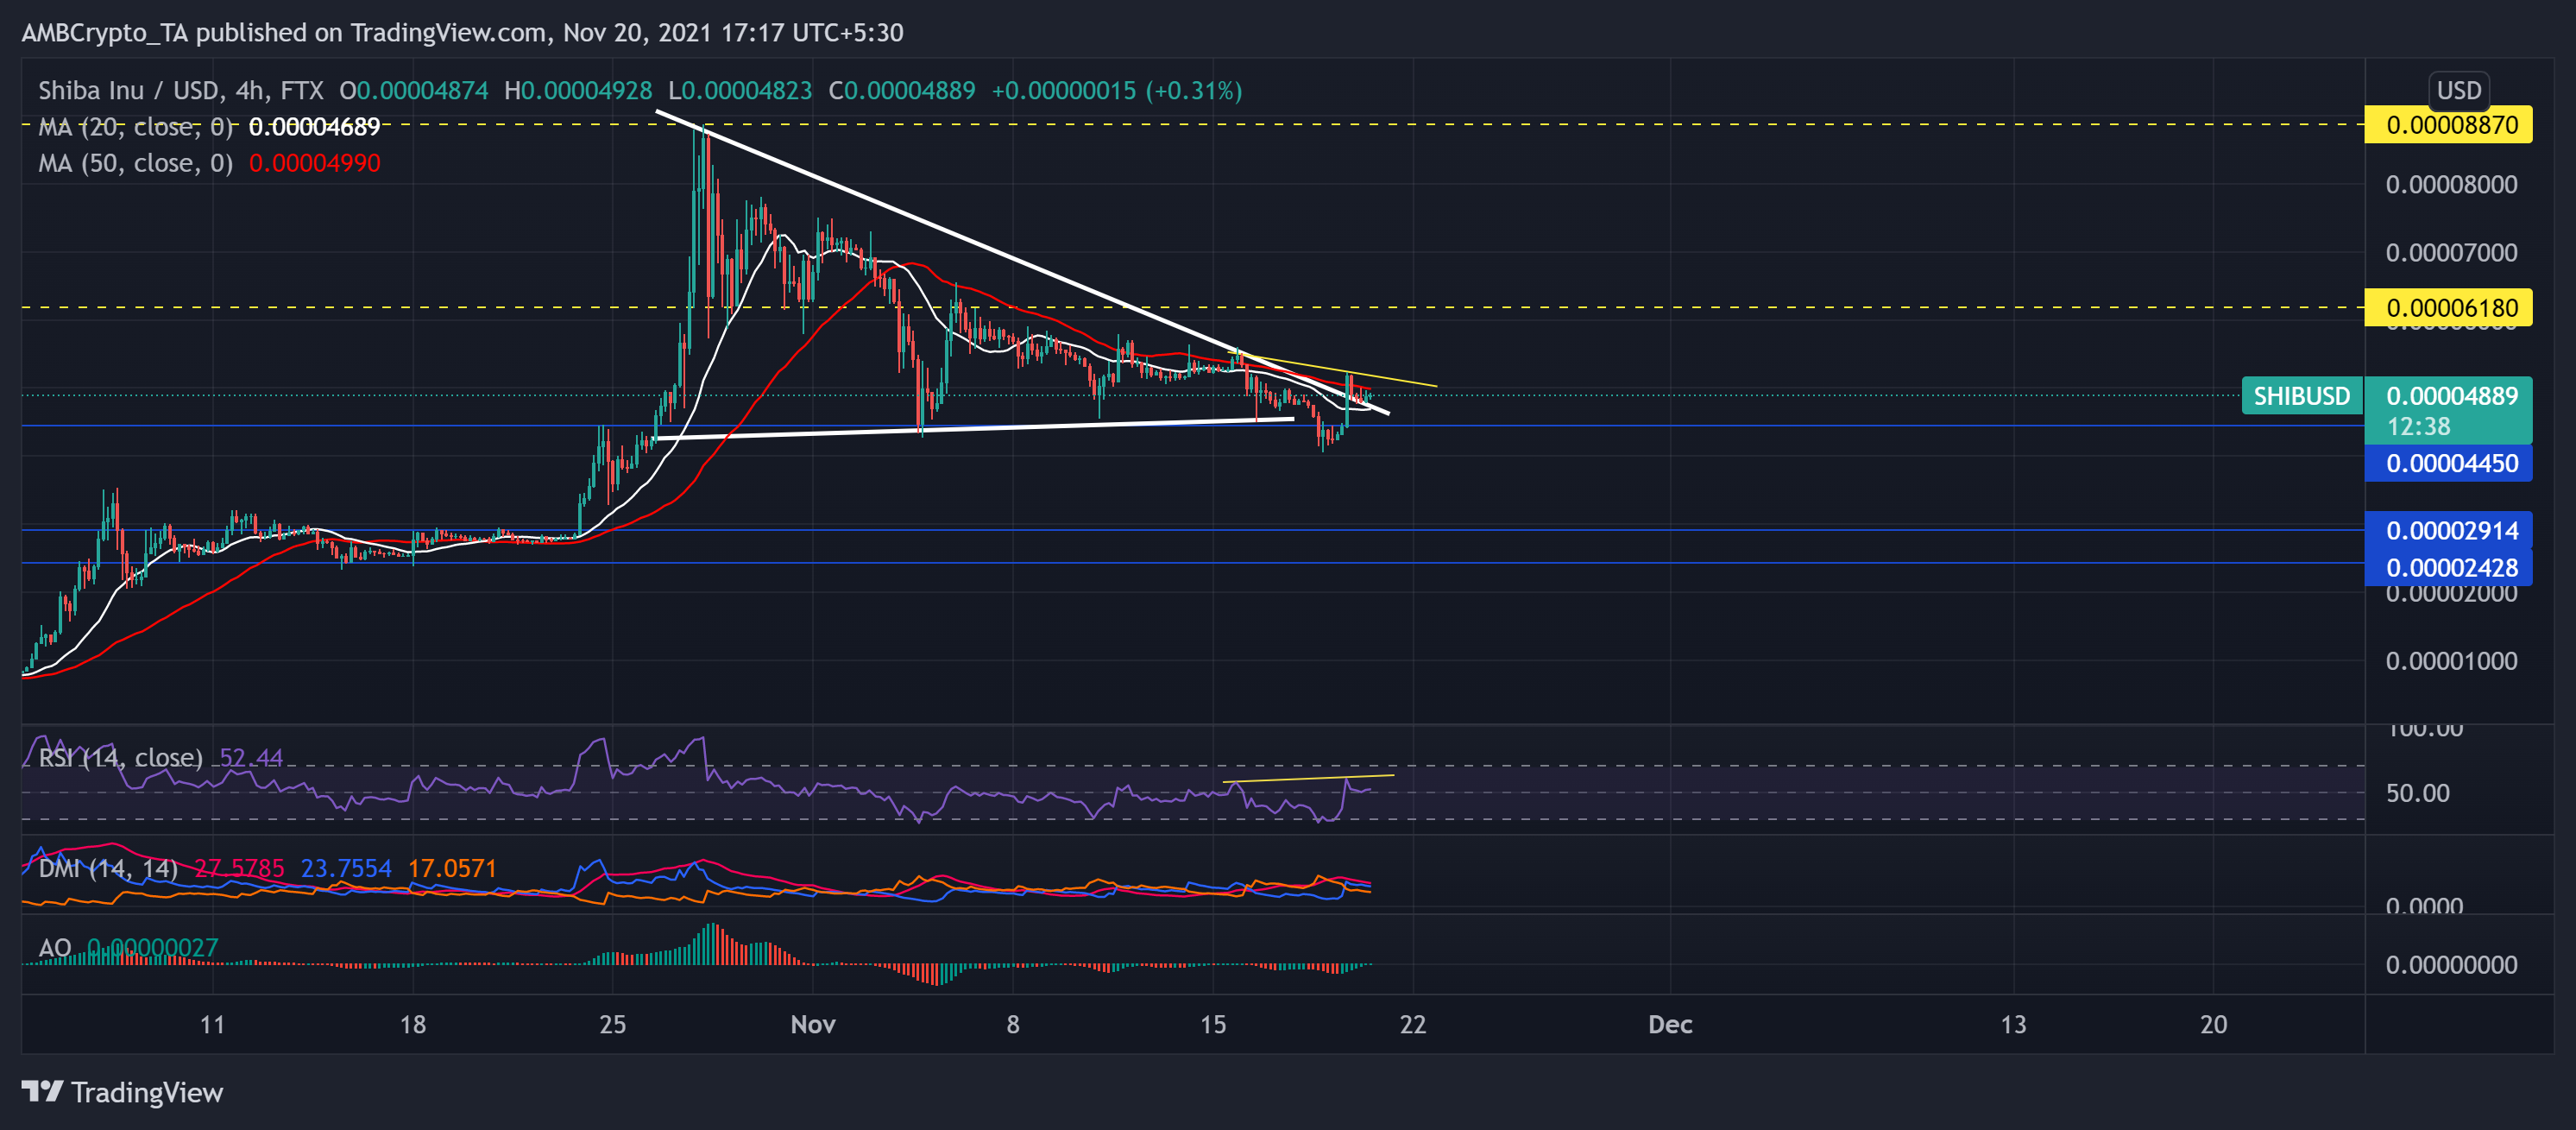
The meme coin was on a steady pullback after it struck its ATH. Since late October, the price reversed in a descending triangle during the correction phase. As a result, SHIB lost over half of its value in the next 19 days and poked its three-week low on 16 November.
Over the past two days, the SHIB army led the crypto market recovery as the alt saw a nearly 13.76% jump in 24 hours. Further, the bulls ensured immediate support at the $0.0000445-mark.
At press time, SHIB traded at $0.00004889 after flashing mixed trading signs. The price transacted below its 4-hour 20-SMA (white) and 50-SMA (red), indicating the existence of bearish influence. Also, the RSI saw a plunge from the 60-mark toward the half-line.
Additionally, a bearish divergence along the RSI and price action hinted at their likely resurgence. However, the DMI chose the bulls while AO pointed at increasing bullish momentum.
Litecoin (LTC)
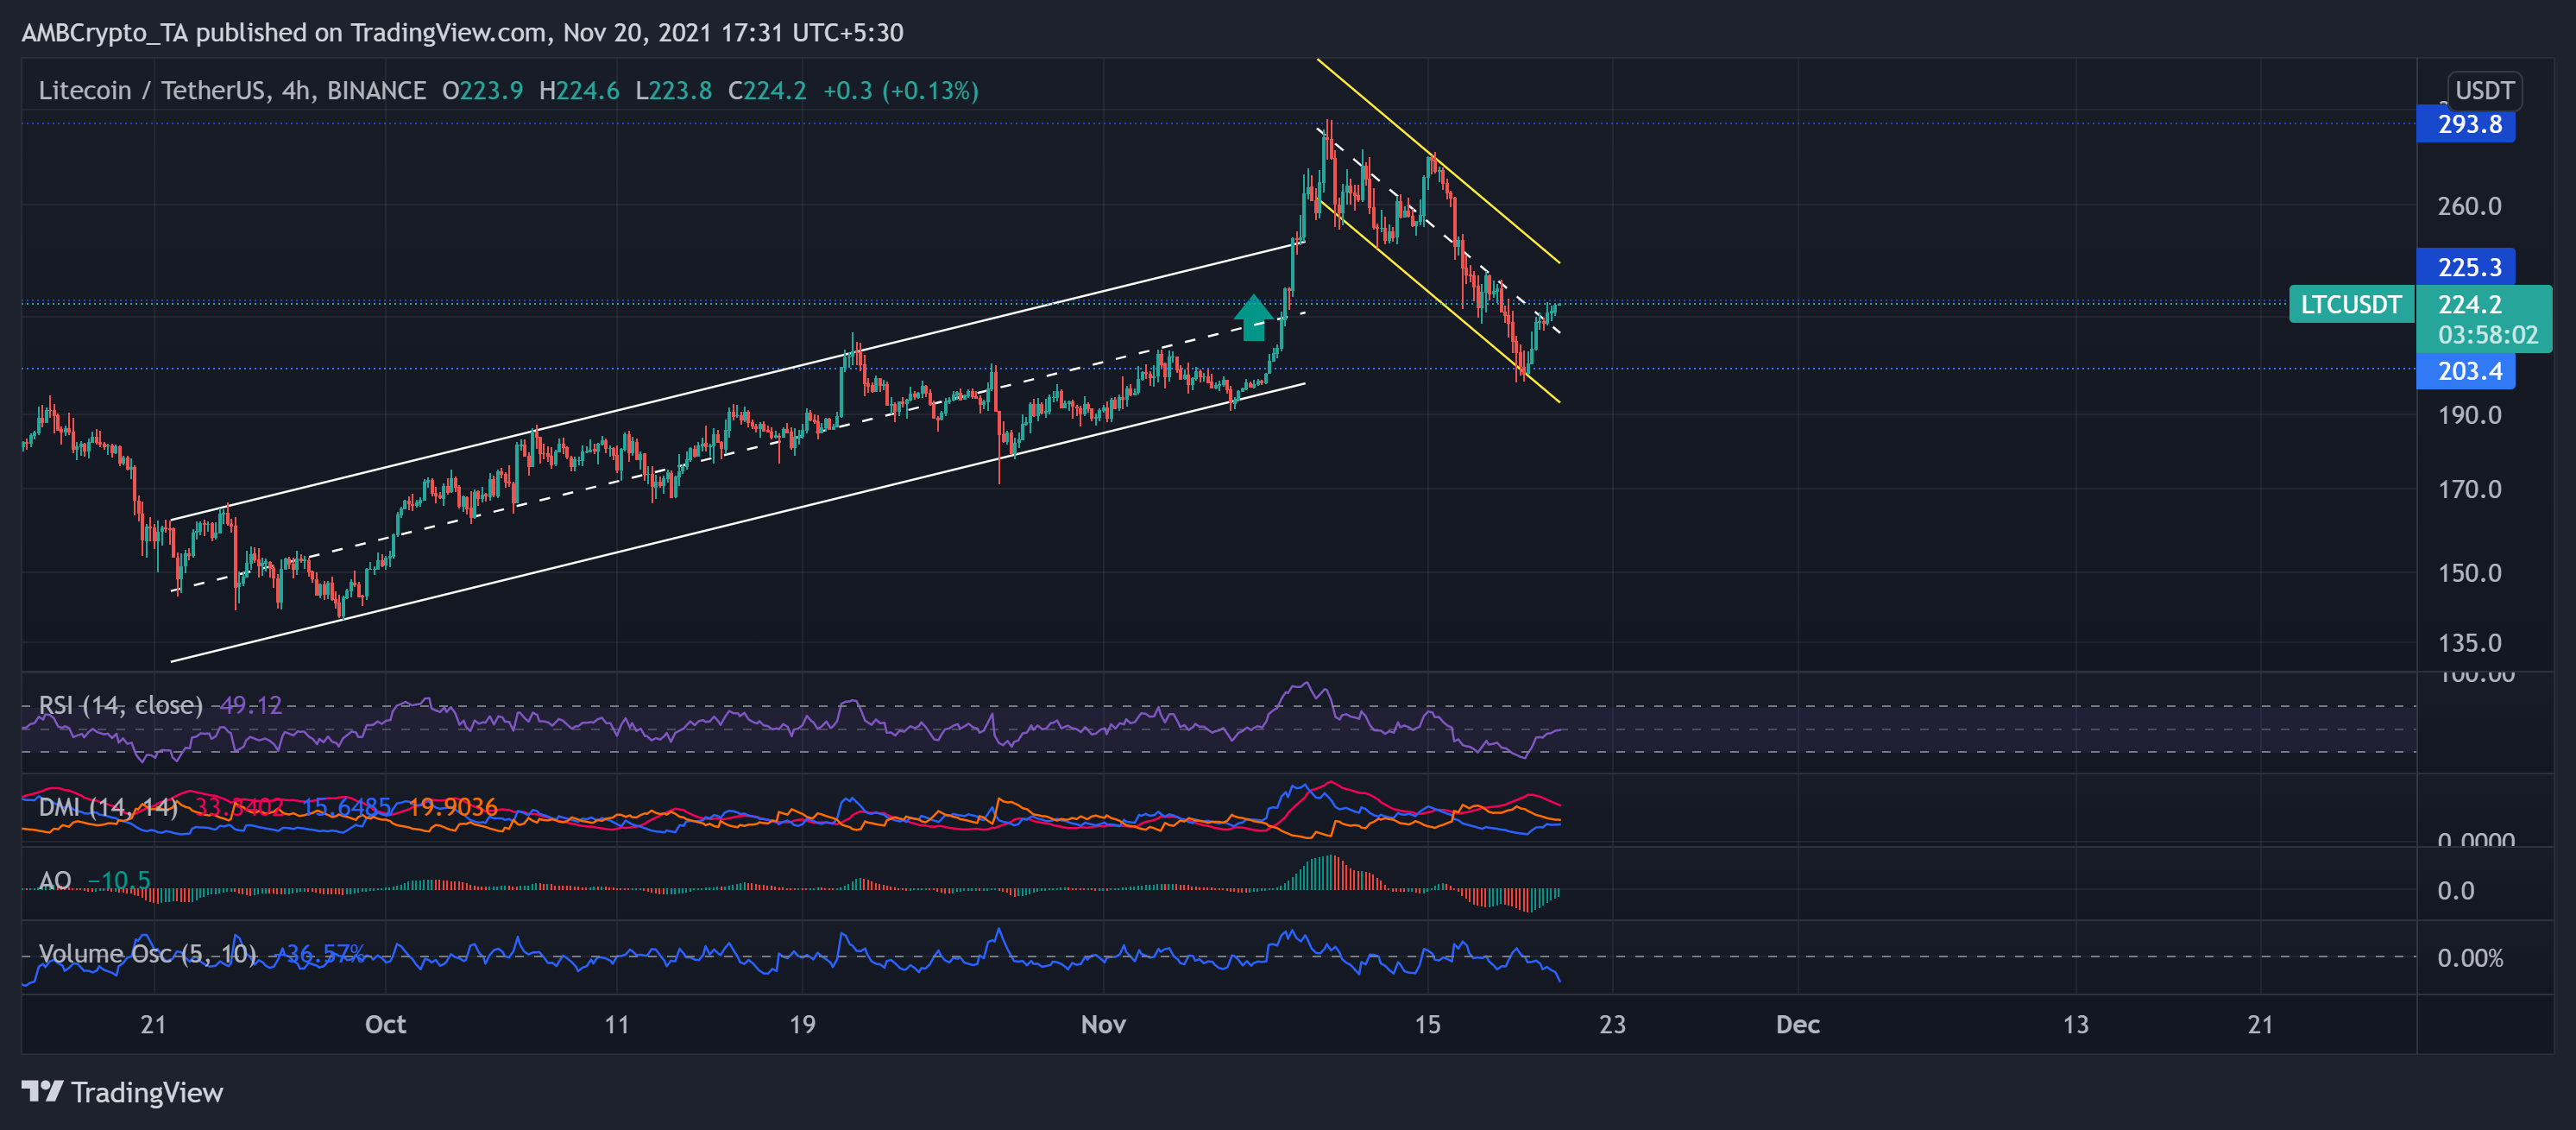
From 29 September, LTC rallied by over 70% until 9 November. As a result, the price action breached the north channel to touch its 25-week high on 10 November.
Since then, the price action withdrew by noting a 32.4% nine-day blip. However, the coin joined the revival bandwagon by registering a 7.7% gain in 24 hours. Also, with this revival, the price action obliged the down channel (yellow) by stepping back into it.
At press time, LTC traded at $224.2. The technical indicators slightly favored the sellers while hinting at their decreasing strength. The RSI surged by 23 points from the oversold territory toward the half-line. While the DMI chose the bears, AO pointed at increasing bullish momentum. However, the bulls couldn’t support the revival with high trading volumes, signaling a weak move on their part.
Loopring (LRC)
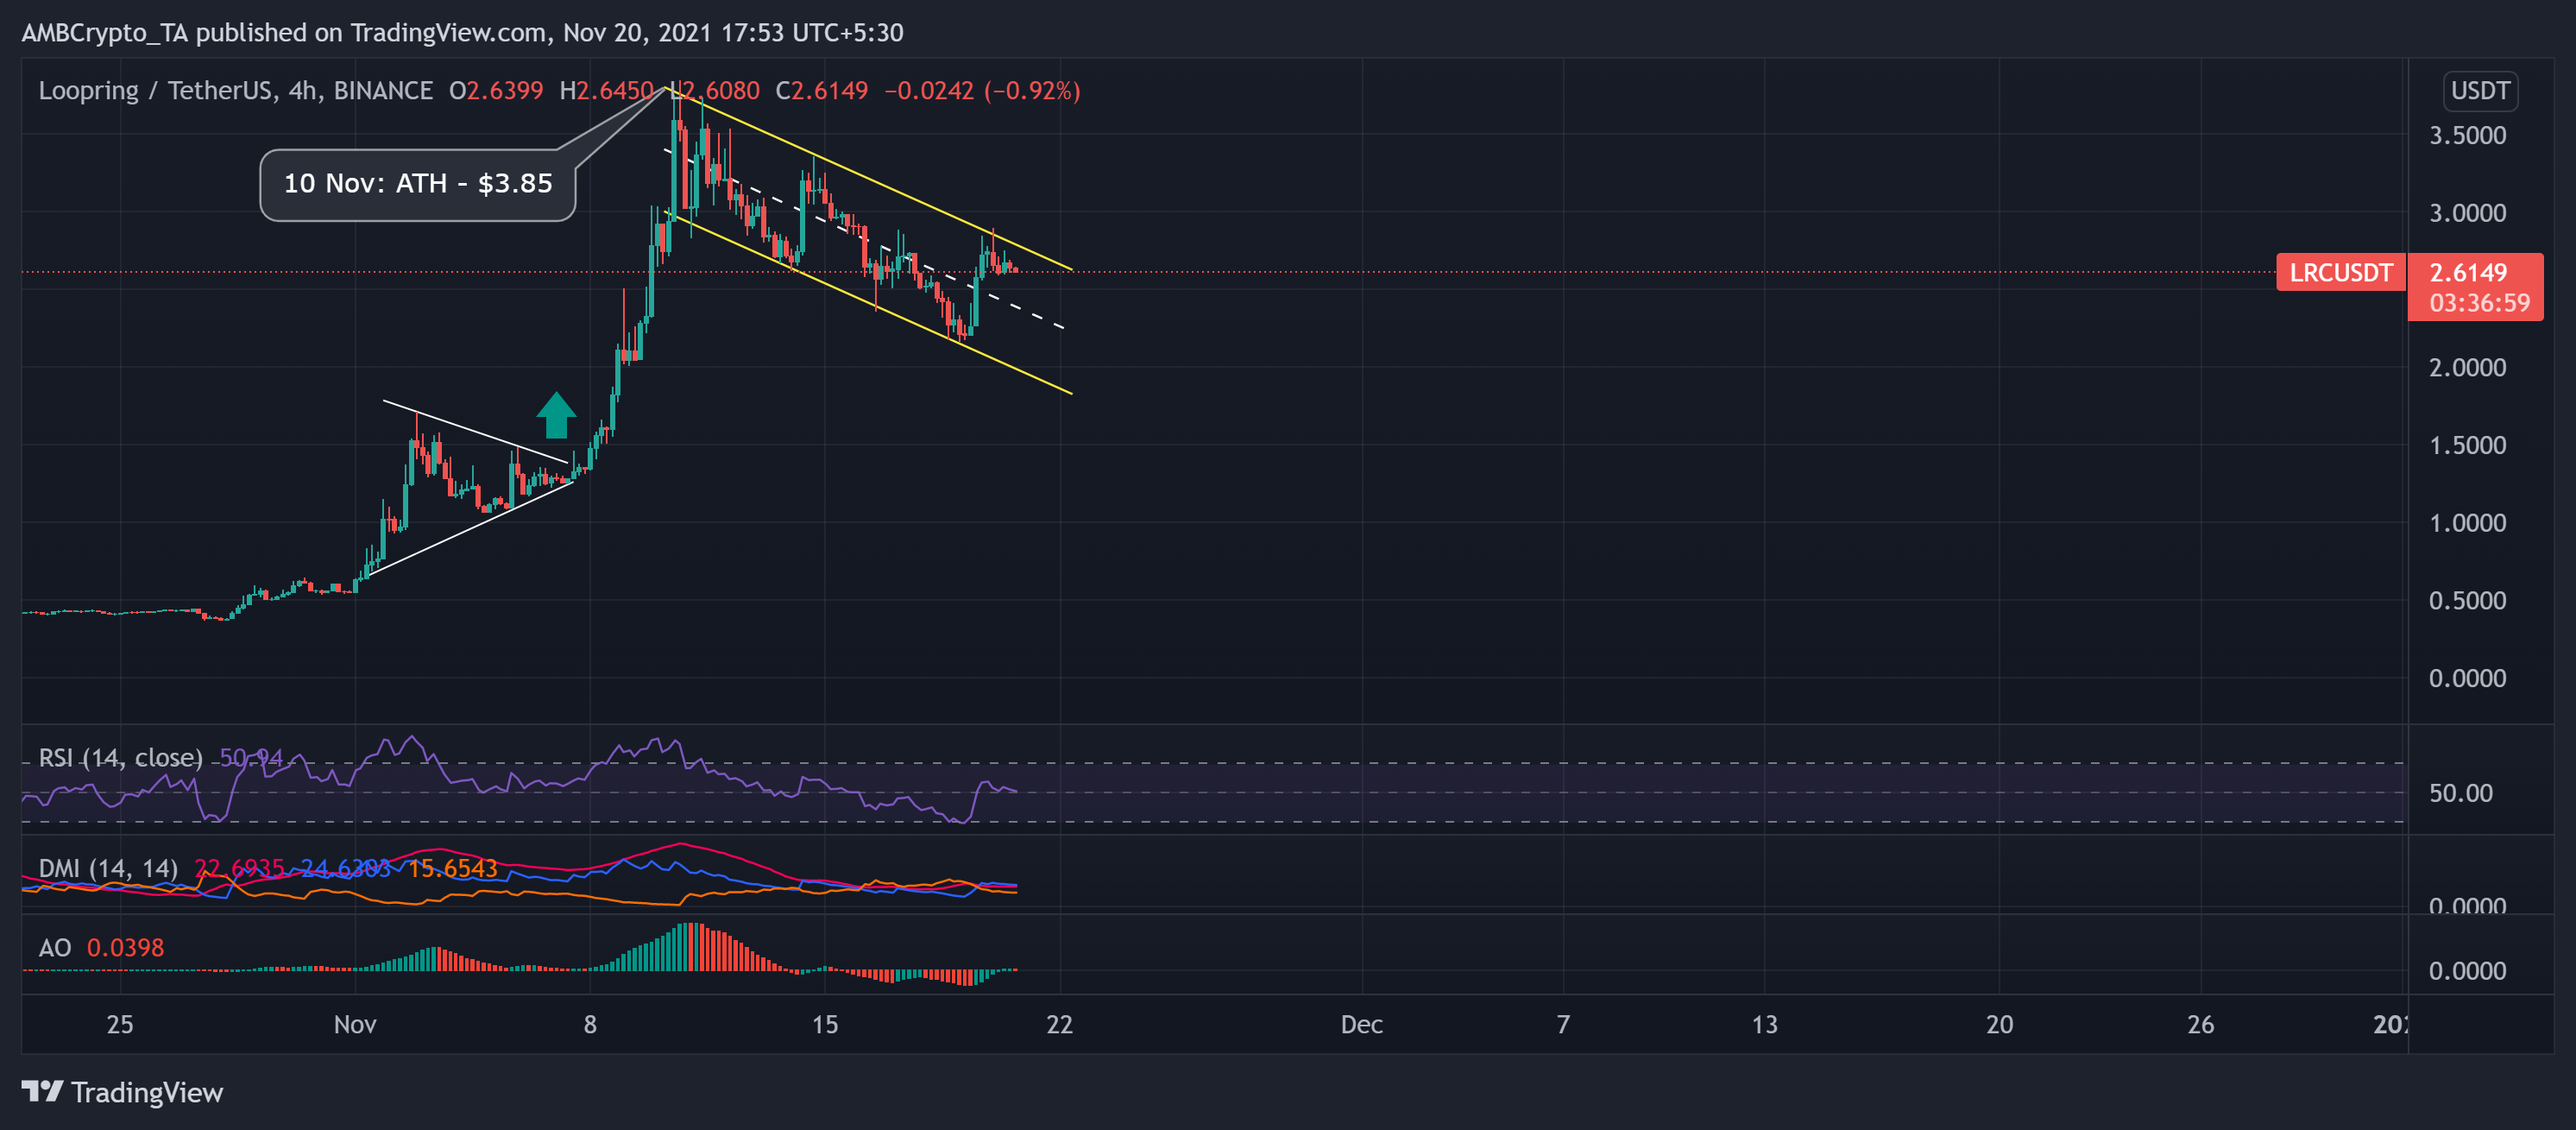
LRC witnessed soaring gains of over 800% from 28 October until 10 November. Post a bull-pennant breakout on 7 November, LRC entered into price discovery and struck its ATH at $3.85 on 10 November.
Since then, the price fell steadily by oscillating between the down channel (yellow). Consequently, the token lost over one-third of its value in the past ten days. Despite a 12.7% rally on 19 November, the price action obliged the trend as it stepped back into it.
At press time, LRC traded at $2.6149. The RSI observed a slight plunge but stayed above the half-line, indicating a bullish inclination. Further, the DMI confirmed this inclination. However, the AO visibly affirmed the slight decrease in bullish influence.