Shiba Inu [SHIB]: The to-do plan to capitalize on this breakout rally

Disclaimer: The findings of the following analysis are the sole opinions of the writer and should not be considered investment advice.
After a classic rectangle bottom setup, Shiba Inu [SHIB] flipped the $0.01217-mark from resistance to immediate support. (For brevity, SHIB prices are multiplied by 1,000 from here on).
With buyers finding rebounding grounds at this support level, SHIB witnessed a patterned breakout towards the basis line (green) of its Bollinger Bands (BB).
A potential close above this line could position the meme-coin for a sustained upside in the coming sessions.
SHIB Daily Chart
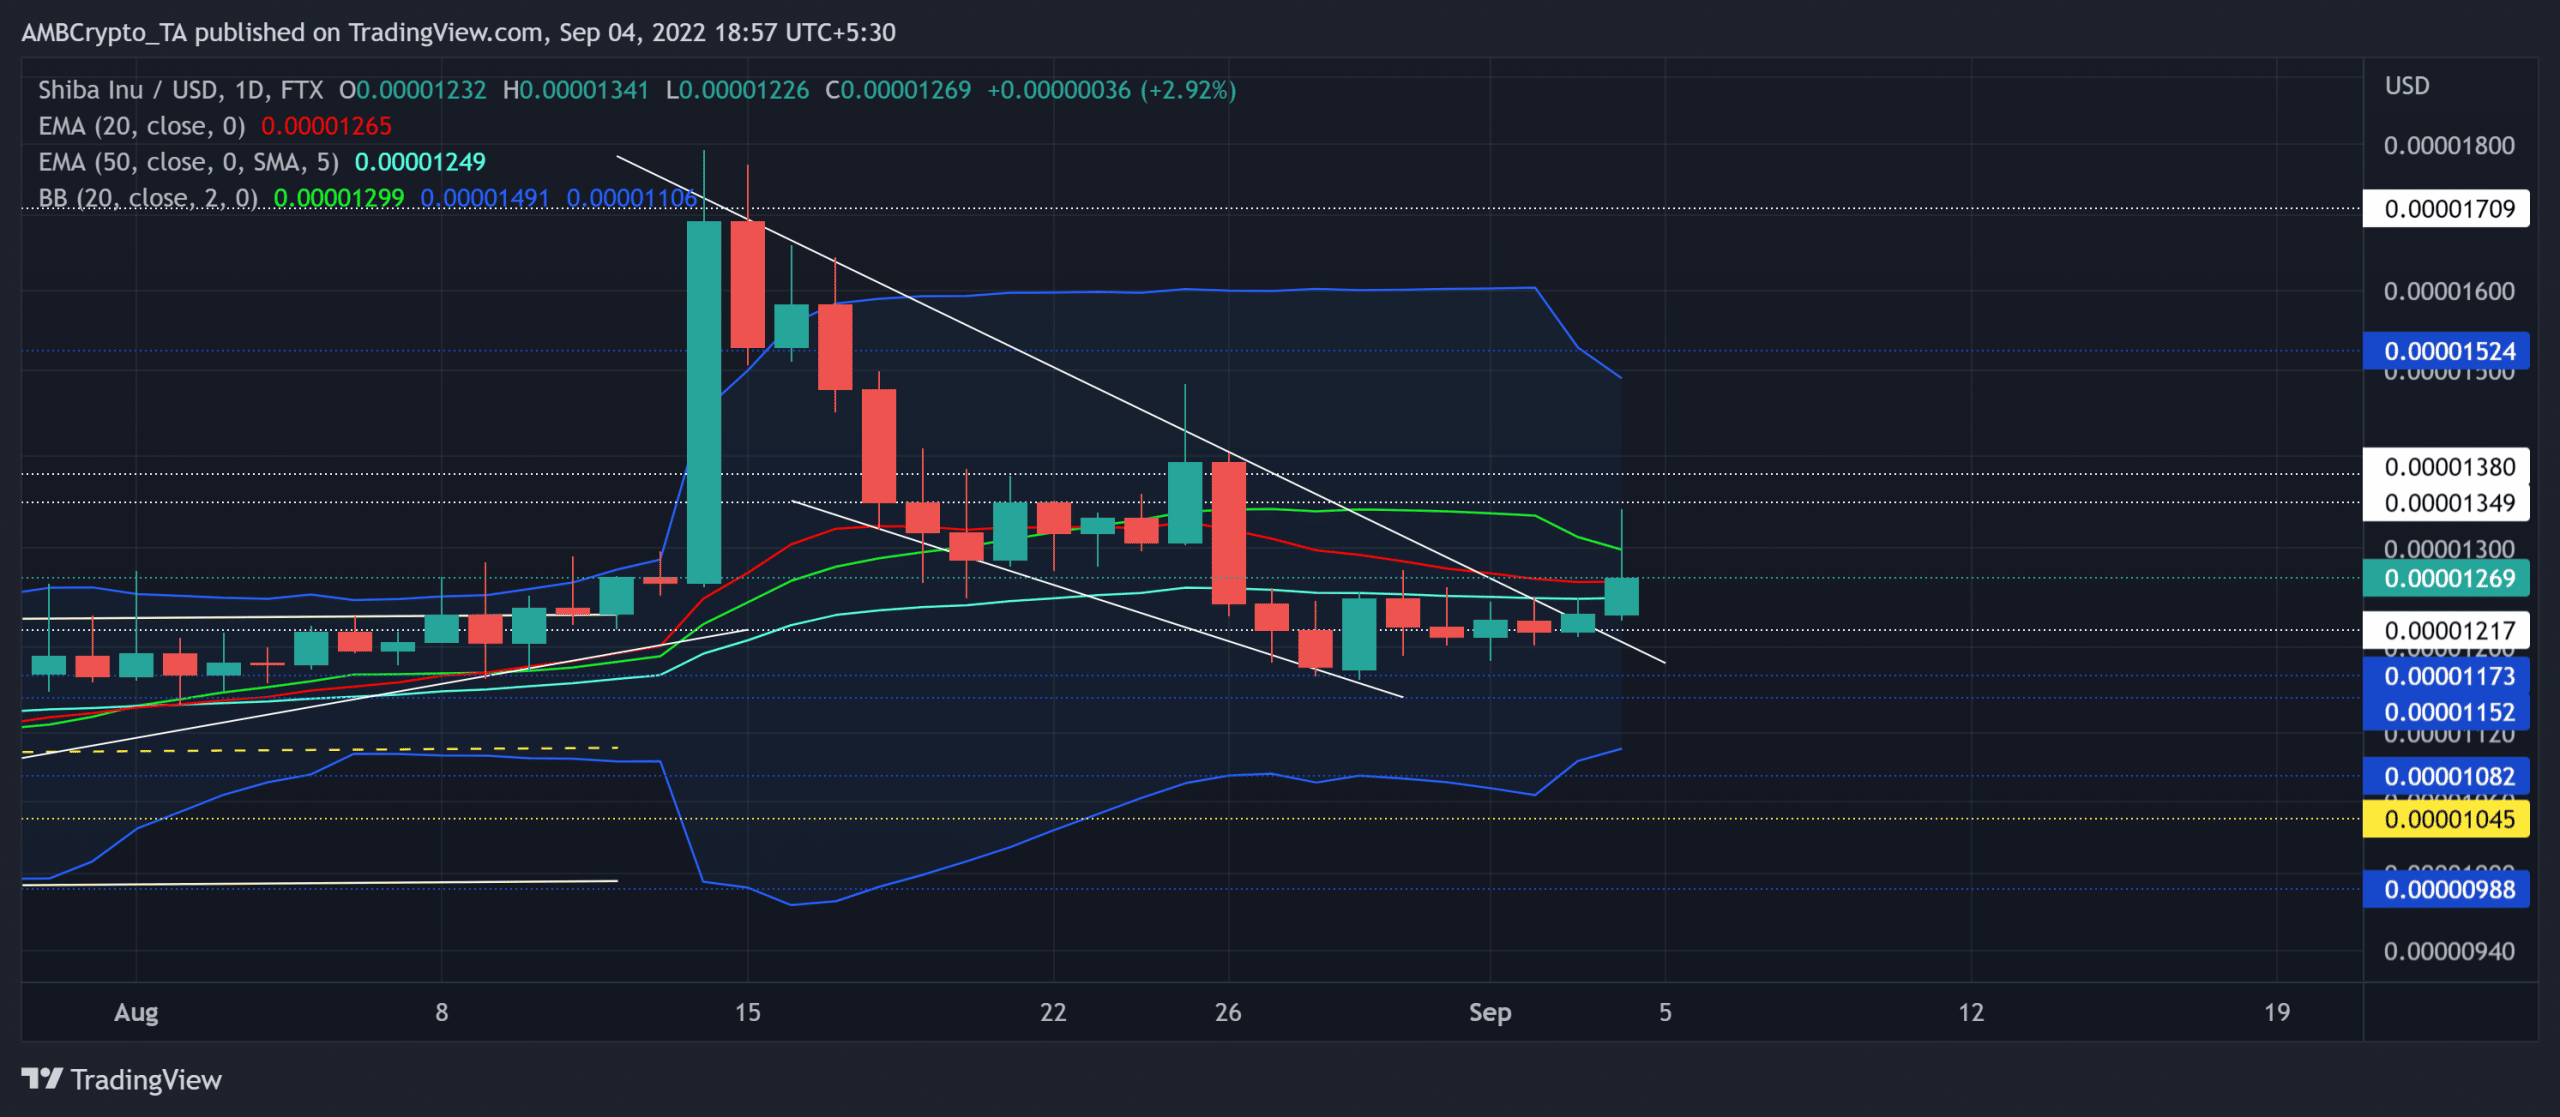
Post maintaining its sideways track for over two months, SHIB bulls have depicted a gradual increase in their force. The buyers kept building up on their underlying pressure, as reflected in the rectangle bottom breakout last month.
Despite witnessing a three-week falling wedge decline, the buying power recouped at the $0.01217-level to inflict a breakout rally. With the 20 EMA (red) still swaying above the 50 EMA (cyan), the bulls would strive to maintain their edge. Any bearish crossovers could hint at a bullish invalidation.
As the upper and lower band of the BB look towards each other, SHIB could see a low volatility phase in the coming days. A hike beyond the basis line in the $0.0129-region can open up recovery gateways towards the $0.0134-$0.0138 range.
Any decline below the $0.01217 baseline would confirm a bearish resurgence and potentially hint at a sustained decline.
Rationale
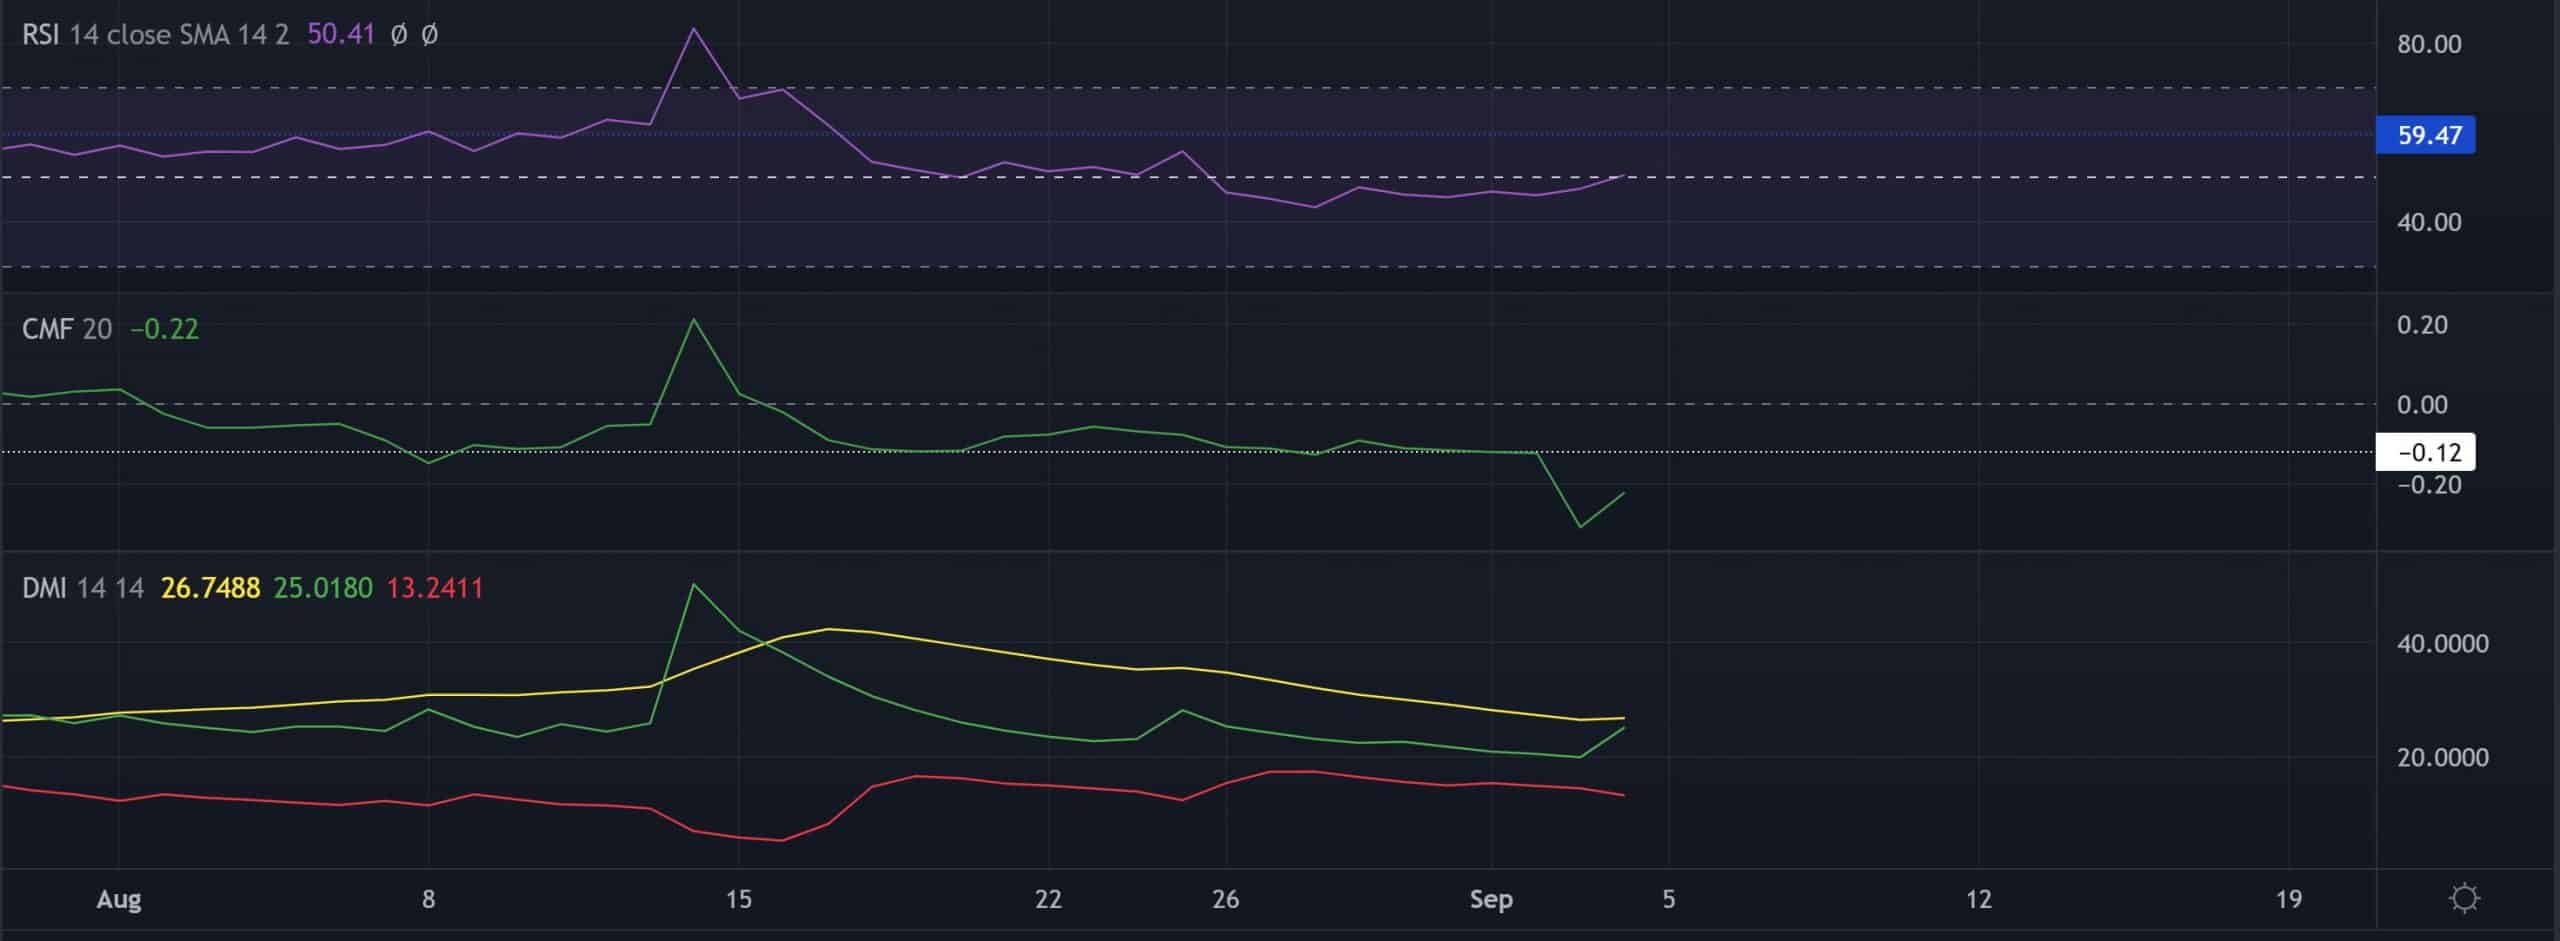
After barely penetrating above the midline, the Relative Strength Index (RSI) saw a slight appreciation in buying edge. However, the buyers must push for a consistent close above the 50-level to capitalize on the recent breakout.
Also, the CMF‘s lower troughs bullishly diverged with the price action. A sustained growth above the -0.12-mark could confirm the bullish bias.
Furthermore, the DMI lines resonated with previous bullish readings. This, even though the ADX (directional trend) was on a consistent downtrend for the last few weeks.
Conclusion
Given the bullish engulfing breakout candlestick on the back of a >55% jump in 24-hour volume, buyers would look to grow above the basis line of BB.
Any reversals below the immediate support could hint at a plausible bear phase. The targets would remain the same as discussed.
Finally, the altcoin shares a 49% 30-day correlation with Bitcoin. Hence, keeping an eye on Bitcoin’s movement with overall market sentiment could be essential in identifying any bullish invalidations.


