Shiba Inu, Tezos, VeChain Price Analysis: 23 February

After Shiba Inu, Tezos and Vechain saw an over 6% gain in the past day, the bullish influence has increased. But they failed to support the rally with promising volumes. Shiba Inu and VeChain saw patterned breakouts while jumping above their near-term moving averages. The RSI for all these cryptos still needed to cross the midline to confirm a change in momentum.
Shiba Inu (SHIB)
As the alt hit its three-month low on 22 January, the buyer stepped in at the $0.000018-mark. Since then, SHIB bulls initiated an over 100% recovery while flipping the $0.000023 from resistance to support.
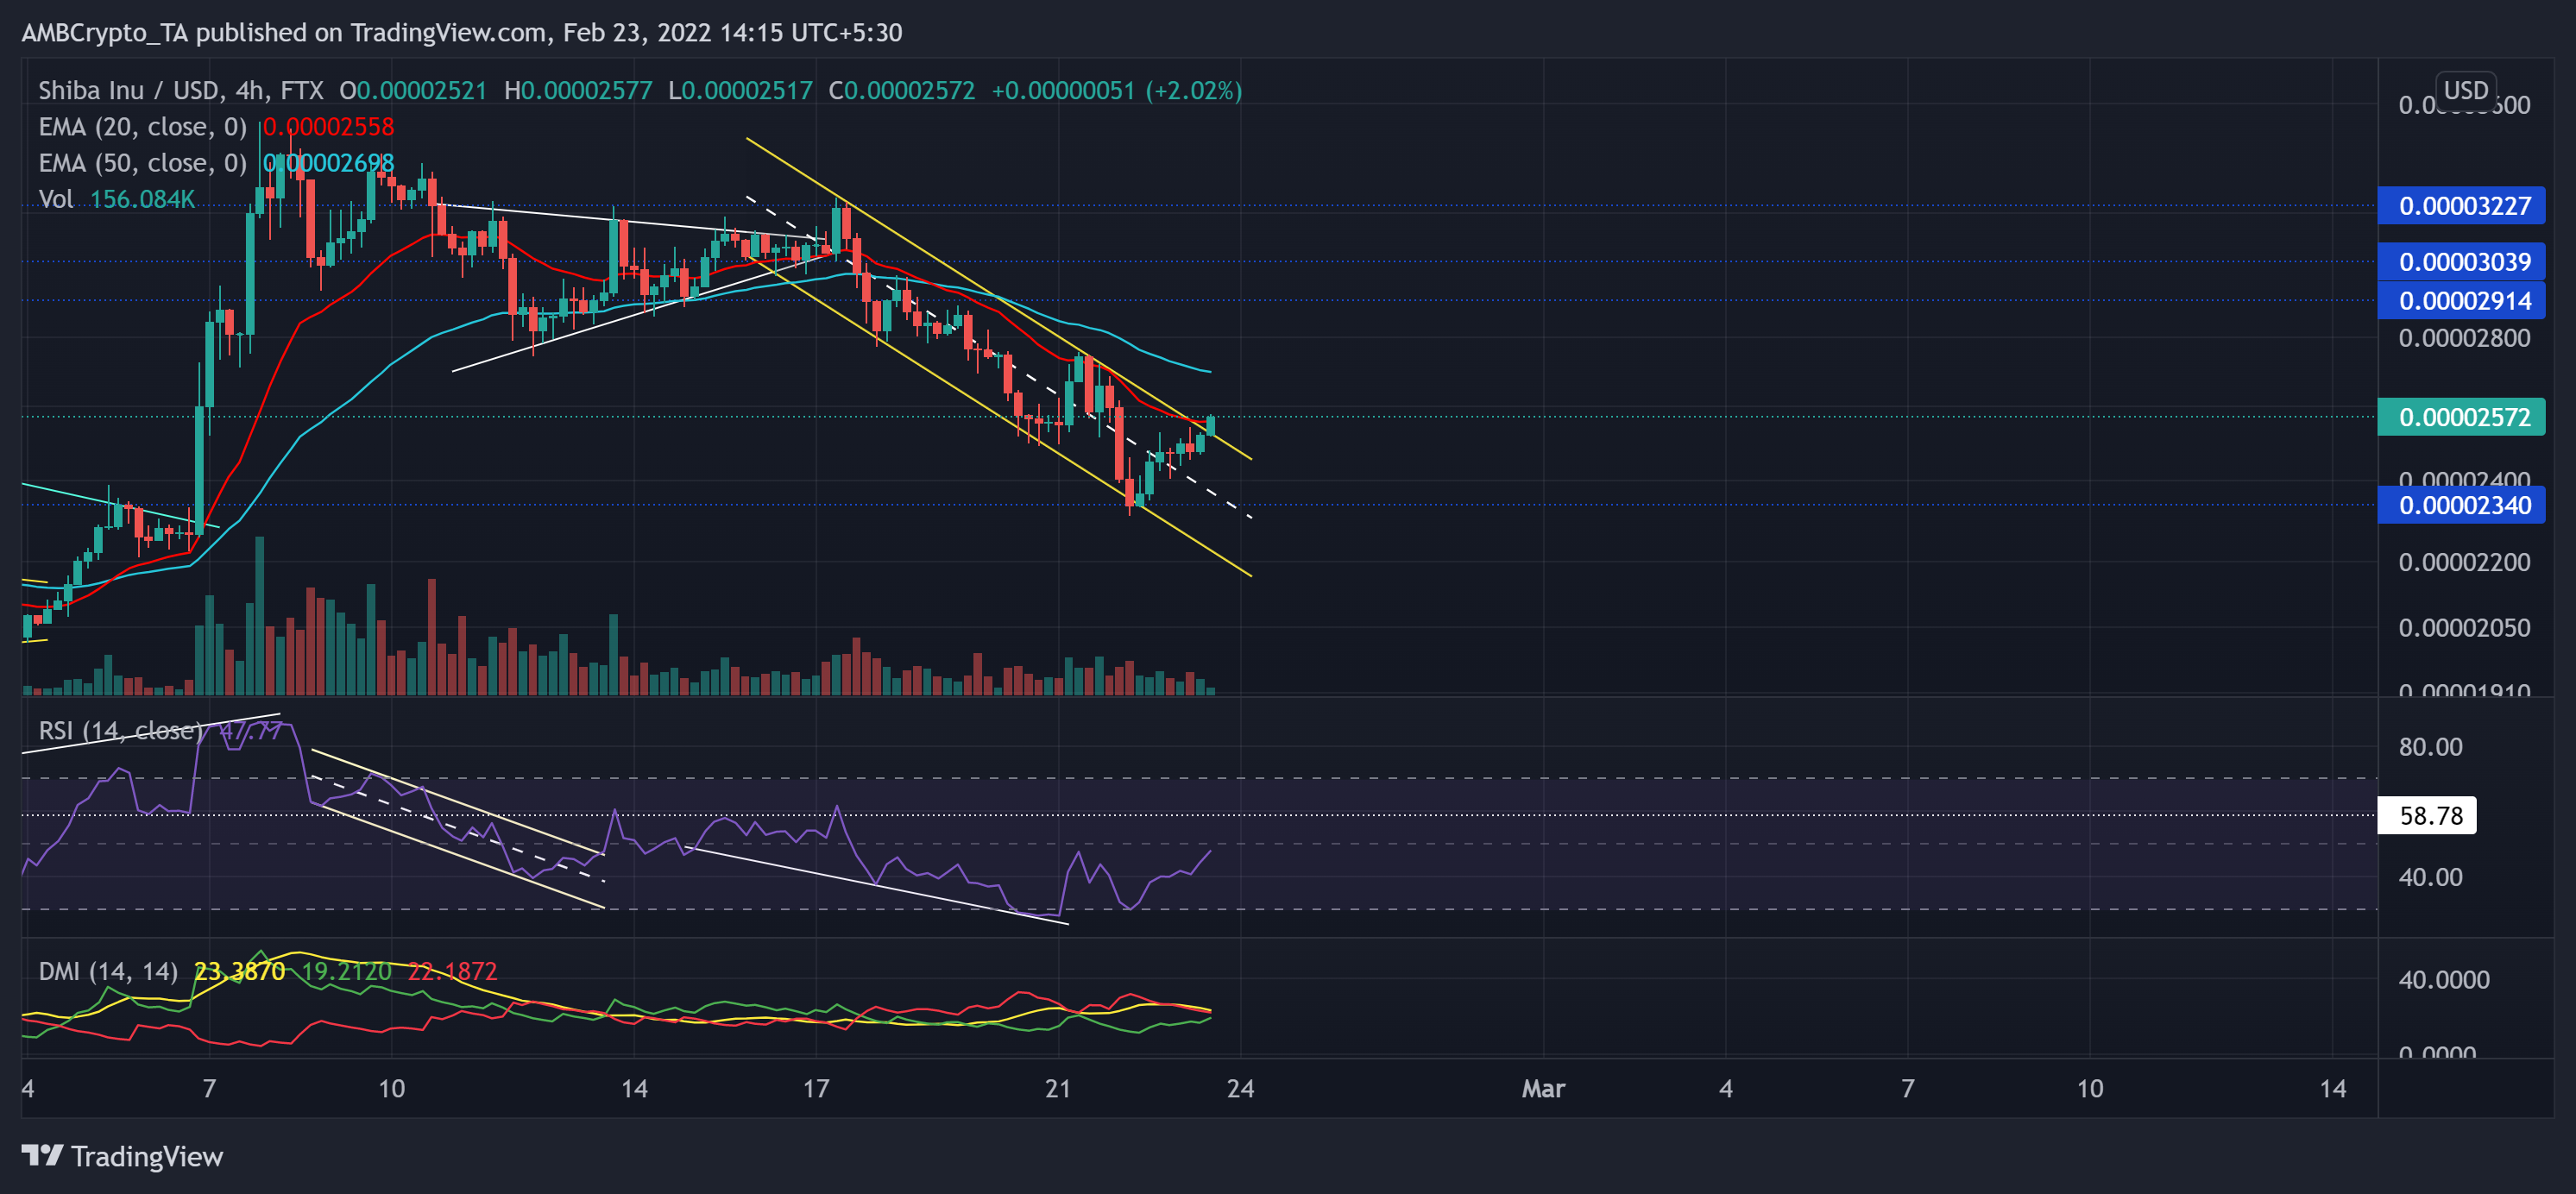
Post which, SHIB bears were keen on pushing the price below the 20/50 EMA. However, with the gains over the last day, SHIB poked above its down-channel (yellow) and aimed to find a close above the 20 EMA (red). This trajectory revealed the increasing buying influence, but it still needed to be backed by enough volumes to be sustainable.
At press time, SHIB was trading at $0.00002572. After swaying in its oversold region, the RSI saw an expected reversal that eyed to test the mid-line resistance. Although the DMI confirmed the increasing buying influence, the ADX still depicted a weak directional trend for SHIB.
Tezos (XTZ)
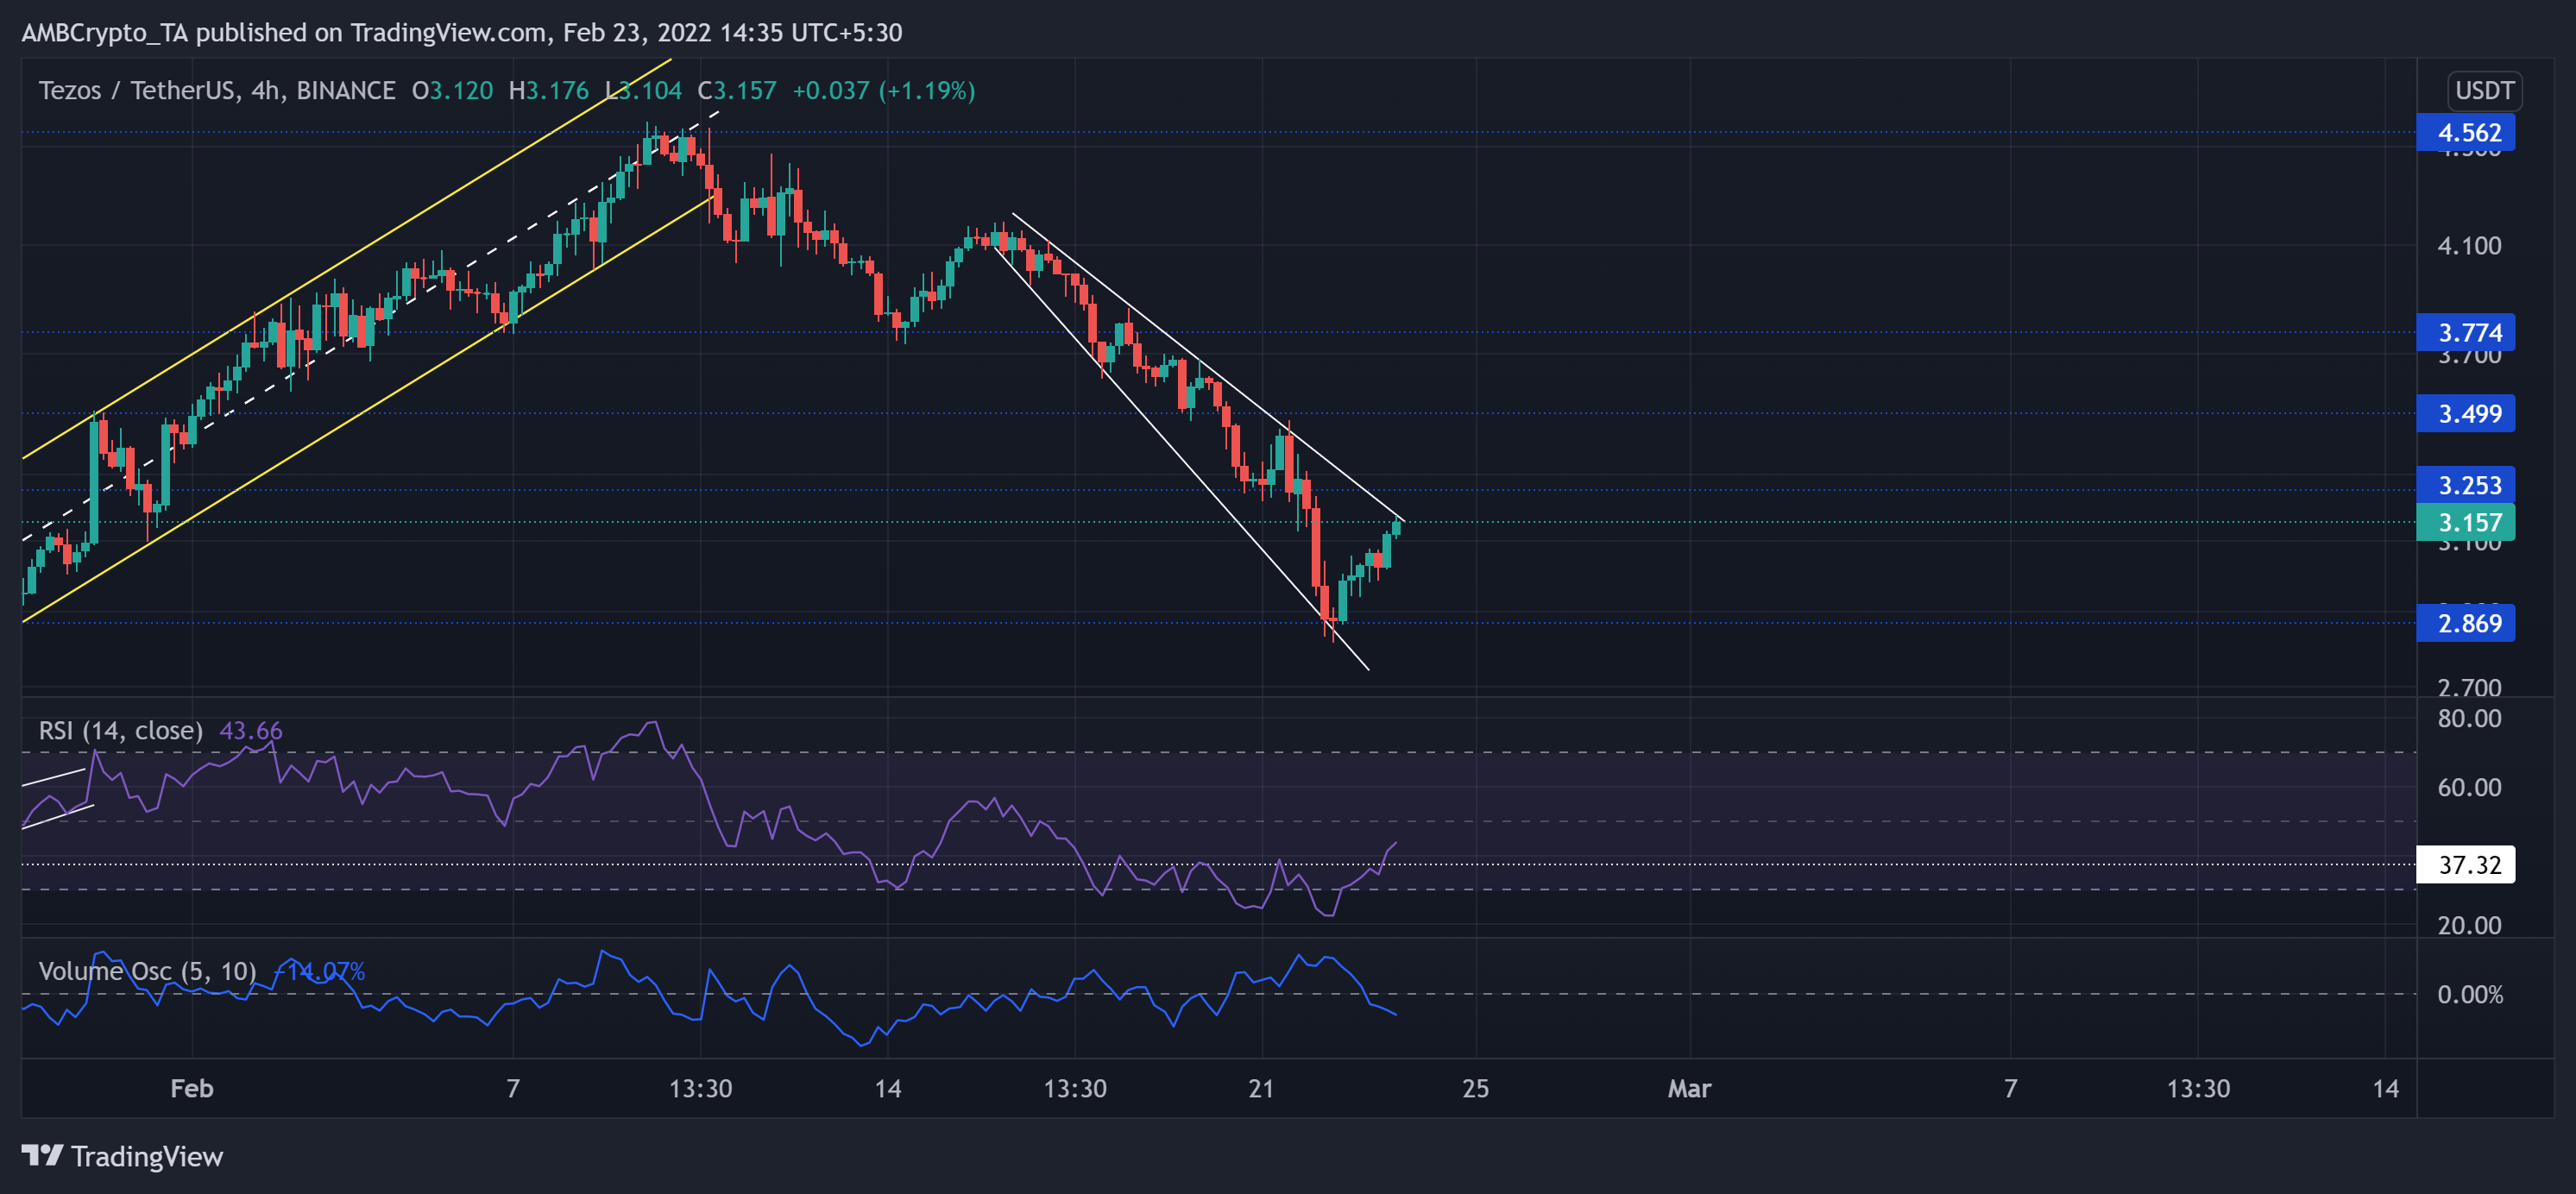
The previous bull rally from its January lows saw staggering gains that halted at the $4.5-mark. Then, XTZ saw a nearly 38.4% pullback in the last 12 days.
Meanwhile, XTZ formed a descending broadening wedge (white) on its 4-hour chart. As the buyers maintained the $2.8-floor, any close above the upper trendline of the wedge could propel a breakout.
At press time, the alt traded at $3.157. Over the last day, the RSI showed revival signs as it rose above the 37-mark. If the buyers keep building up pressure, XTZ eyed to test its mid-line resistance. But the Volume Oscillator was declined below its equilibrium during this phase, hinting at a weak bull move.
VeChain (VET)
Since poking its 11-month low on 24 January, VET saw a 58.1% recovery as it tested the $0.069-resistance on 8 February. Over the past few days, VET formed a down-channel (yellow) on its 4-hour chart.
After the 24-hour gains, the bulls broke out of the pattern and aimed to overturn the $0.049-mark. Any retracements would see a test near the $0.046-mark before committing itself to a trend.
At press time, VET traded below its 50-200 SMA at $0.04912. The RSI broke out its downtrend from the oversold region. It now aimed to find a test of its mid-line. But like XTZ, the Volume Oscillator pointed at a weak bullish motion.


