Shiba Inu: Traders who missed out on the rally can long this bullish pattern

Disclaimer: The findings of the following analysis are the sole opinions of the writer and should not be taken as investment advice
“Dogecoin killer” Shiba Inu led the charge among meme coins on Tuesday and jumped by 57% in the last 24 hours. Spurred on by a healthier broader market and possibly an Elon Musk tweet, Shiba Inu punched past a sturdy resistance and set up a 4-month high at $0.00001520.
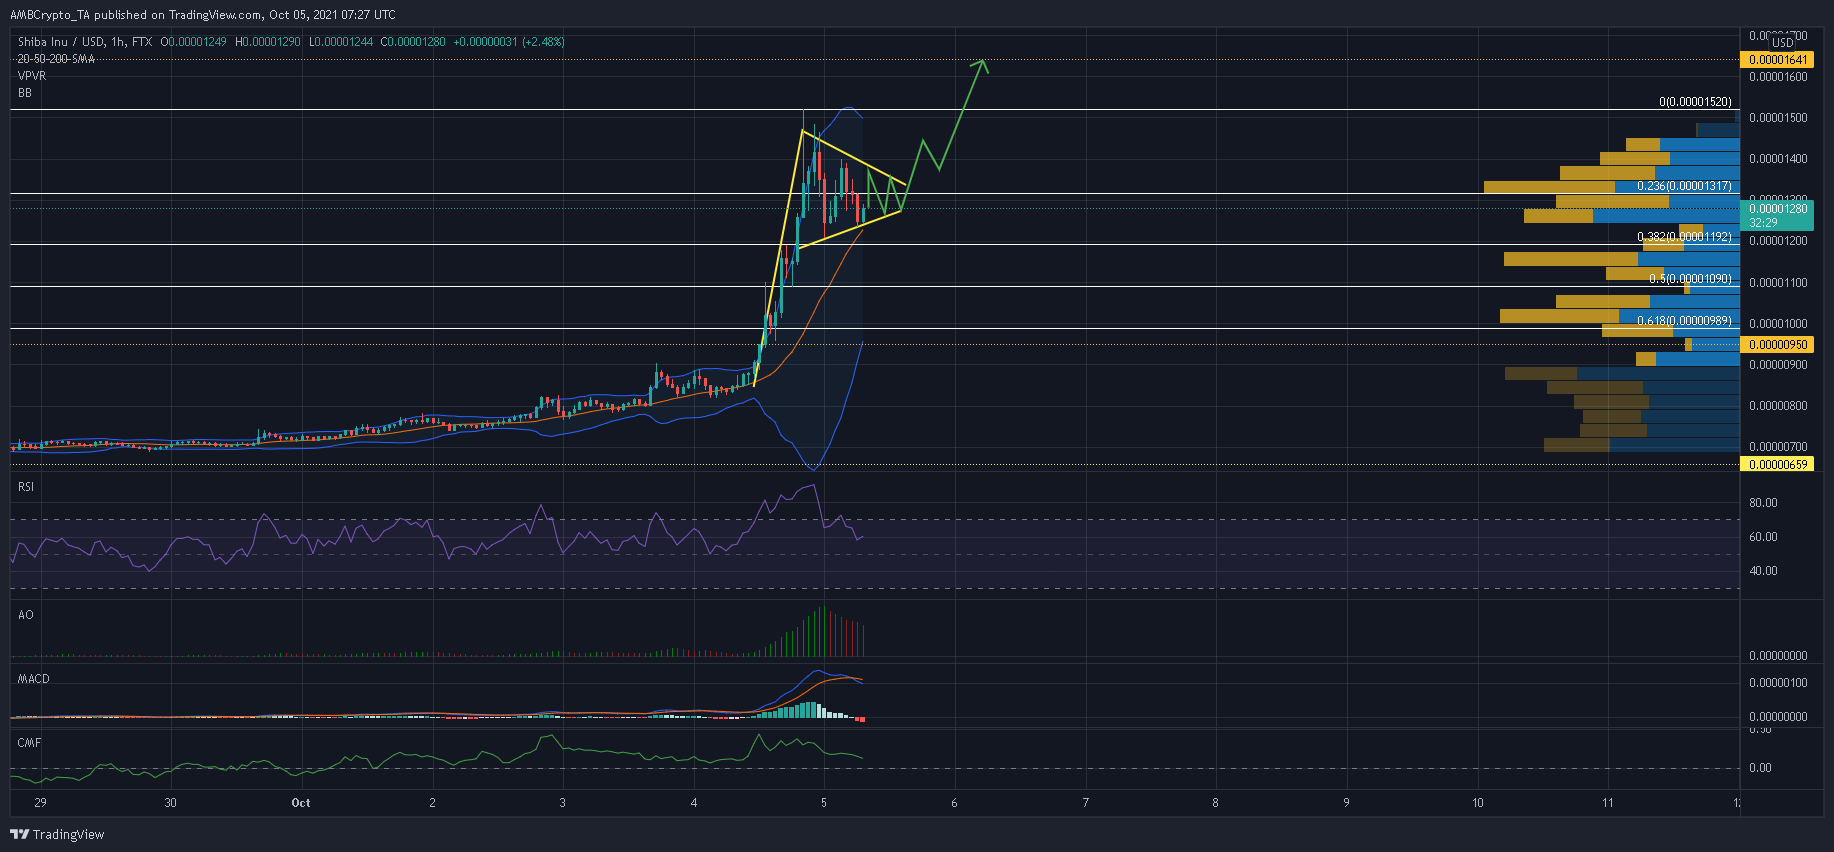
Traders who have missed out on the remarkable run-up can get in on the action provided a bull pennant comes to fruition. Meanwhile, sellers should eye a return to normalcy by targeting a close below the 50% Fibonacci level, setting up a comeback to SHIB’s value zone.
SHIB Hourly Chart
SHIB began October on a favorable note by setting up a 18% surge in the first four days. The meme coin was also unfazed by the lack of demand at $0.00000950 and sliced through this resistance with relative ease – A development that allowed SHIB to register another 60% surge in value.
Short-term traders who have missed out on the rally can wait for a bull pennant to develop as SHIB blows off some steam. A successful breakout would allow SHIB to tackle price levels at $0.00001640 and $0.00001800.
On the other hand, a close below the 38.2% Fibonacci level would mark an end to SHIB’s upcycle and negate the bullish pattern. The lack of strong support areas could see SHIB slip down all the way to its 61.8% Fibonacci level before a rebound.
Reasoning
The Relative Strength Index was stabilizing after breaching the overbought zone for the fifth time in the last six days. The mid-line functioned as support during this period and a favorable outcome can be expected as long as the index does not fall below 50-55.
The candles were also within the mid-line of the Bollinger Bands. This could attract some more buying pressure. However, a bearish crossover on the MACD could keep buyers under the lid.
Conclusion
SHIB could continue to see higher levels if a bull pennant takes shape over the next few sessions. A breakout from the pattern would push SHIB to $0.00001640 and even, $0.00001800. However, losing out on the 38.2% Fibonacci level would be a big blow for bullish traders.
A retest of the 61.8% Fibonacci level can be expected in this scenario.


