Shina Inu, Chainlink, VeChain Price Analysis: 21 November

Just as the market entered a recovery phase, the bulls could not sustain their rally with a robust force. Accordingly, altcoins like Shiba Inu, Chainlink, VeChain saw losses on their daily charts after an attempted revival.
Broader standpoint remained skewed in favor of bears along with the likelihood of increasing bullish power.
Shiba Inu (SHIB)
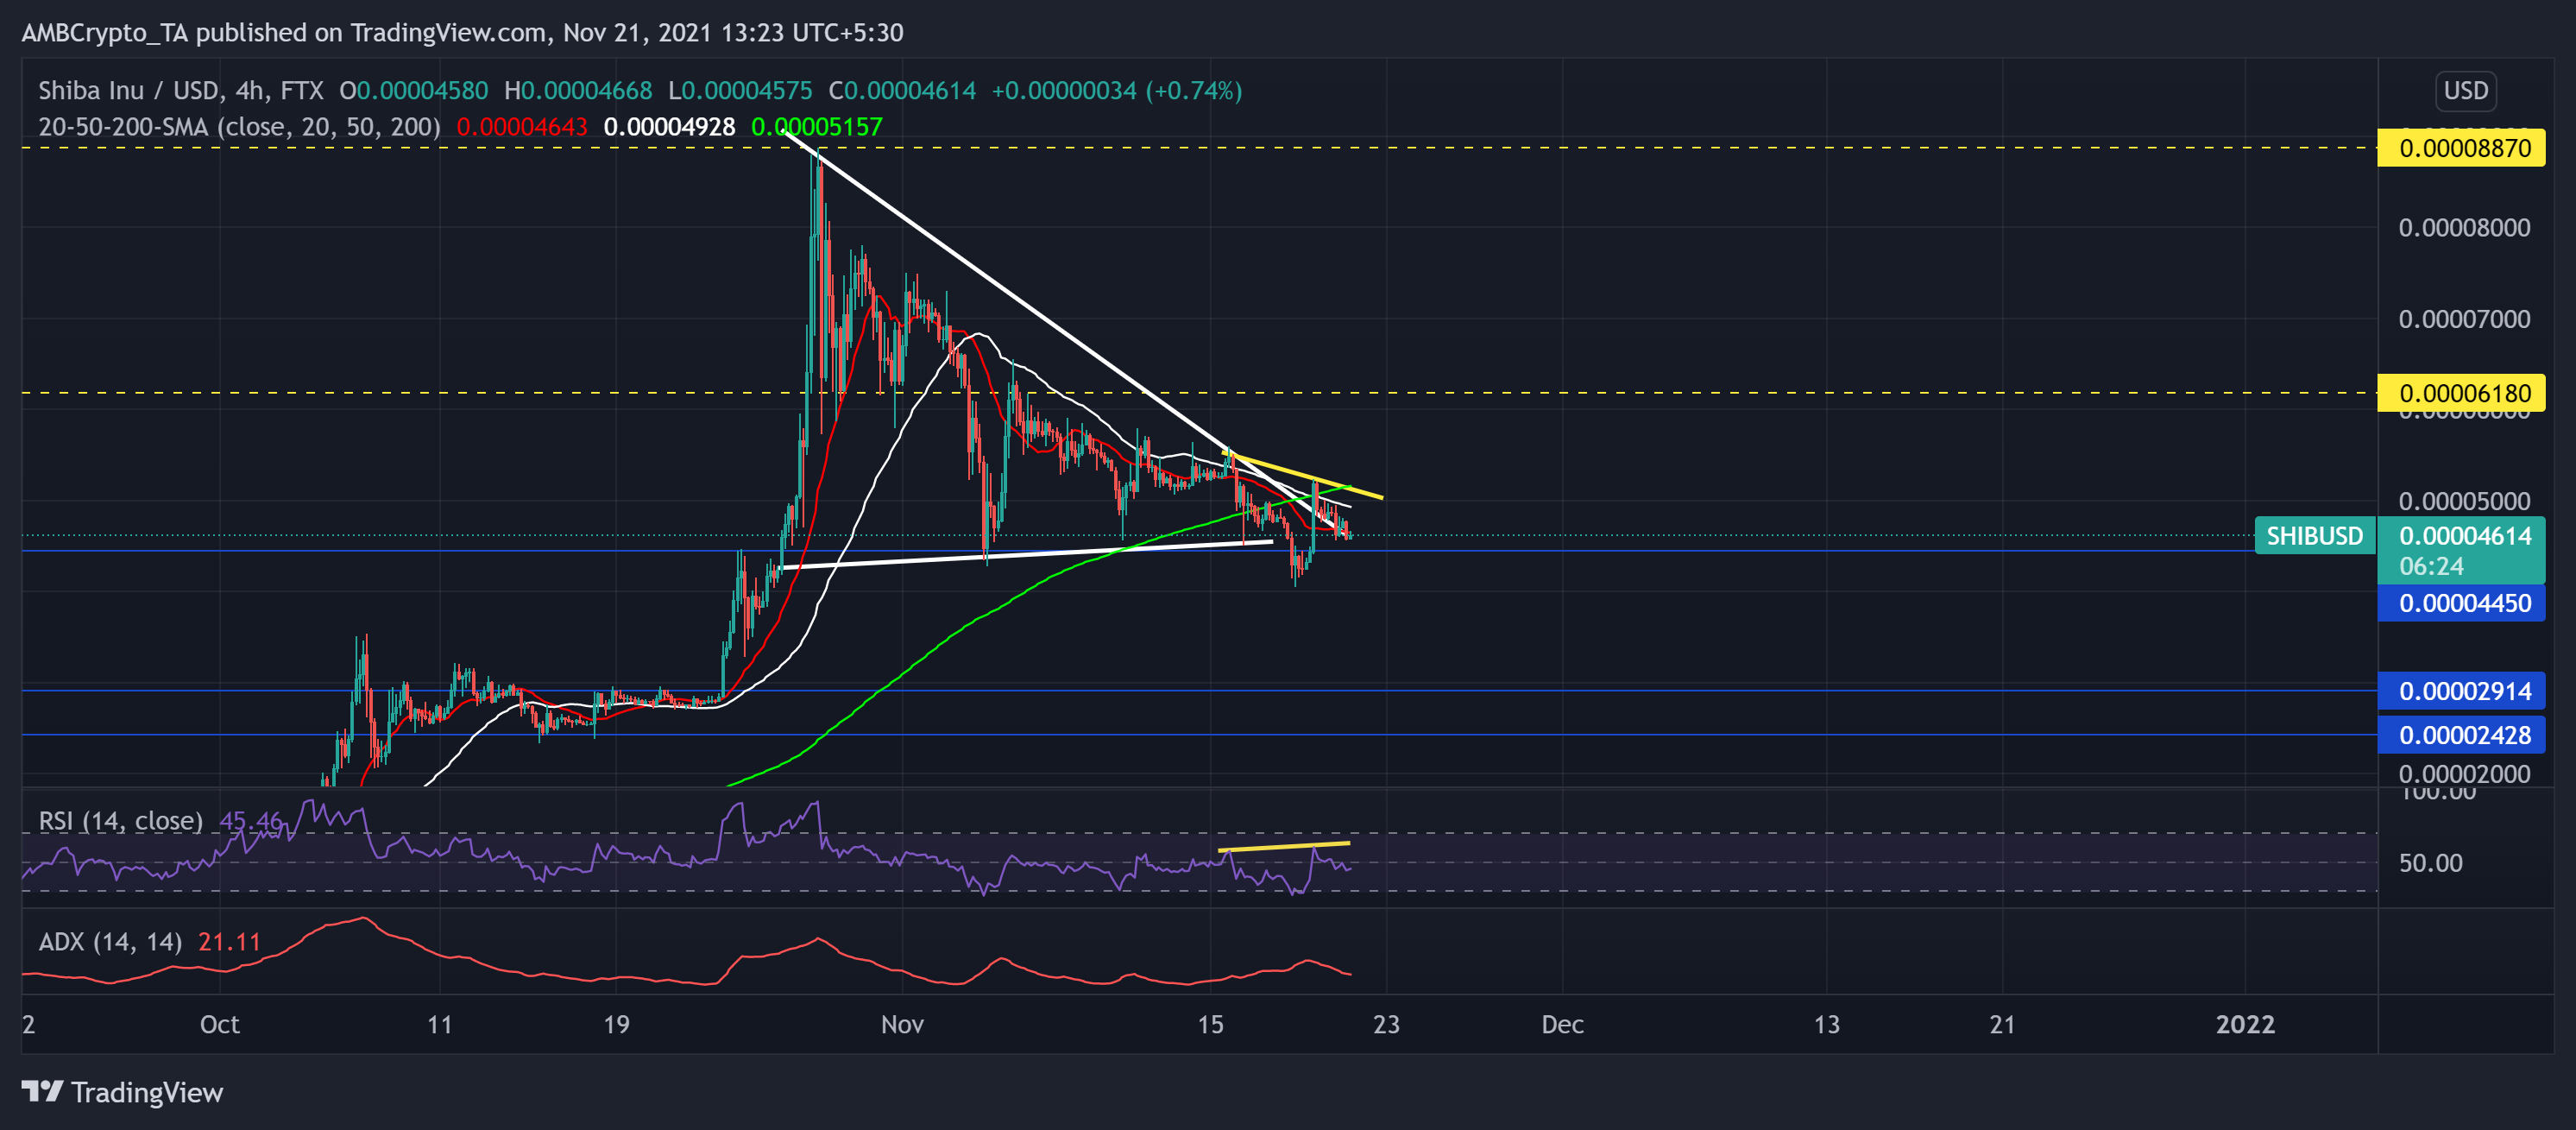
The meme coin could not sustain its 213% October-end rally. Thus, the token steadily declined after striking its ATH on 28 October. Since then, SHIB has flashed a bearish outlook while the price fell in a descending triangle pattern. The correction phase led SHIB to a 54% loss in the next 21 days. Consequently, it poked its three-week low on 18 November.
Over the next two days, the alt saw a nearly 13.76% jump on 19 November. However, bulls failed to hold their ground as SHIB registered a 5.42% loss in 24 hours.
At press time, SHIB traded at $0.00004614. The price transacted below its 4-hour 20-50-200 SMA, indicating the existence of bearish influence. Also, the RSI saw a plunge from the 60-mark to below the half-line. Additionally, a bearish divergence along the RSI and price action hinted at a continued bearish trend. However, the ADX displayed a weak directional swing.
Chainlink (LINK)
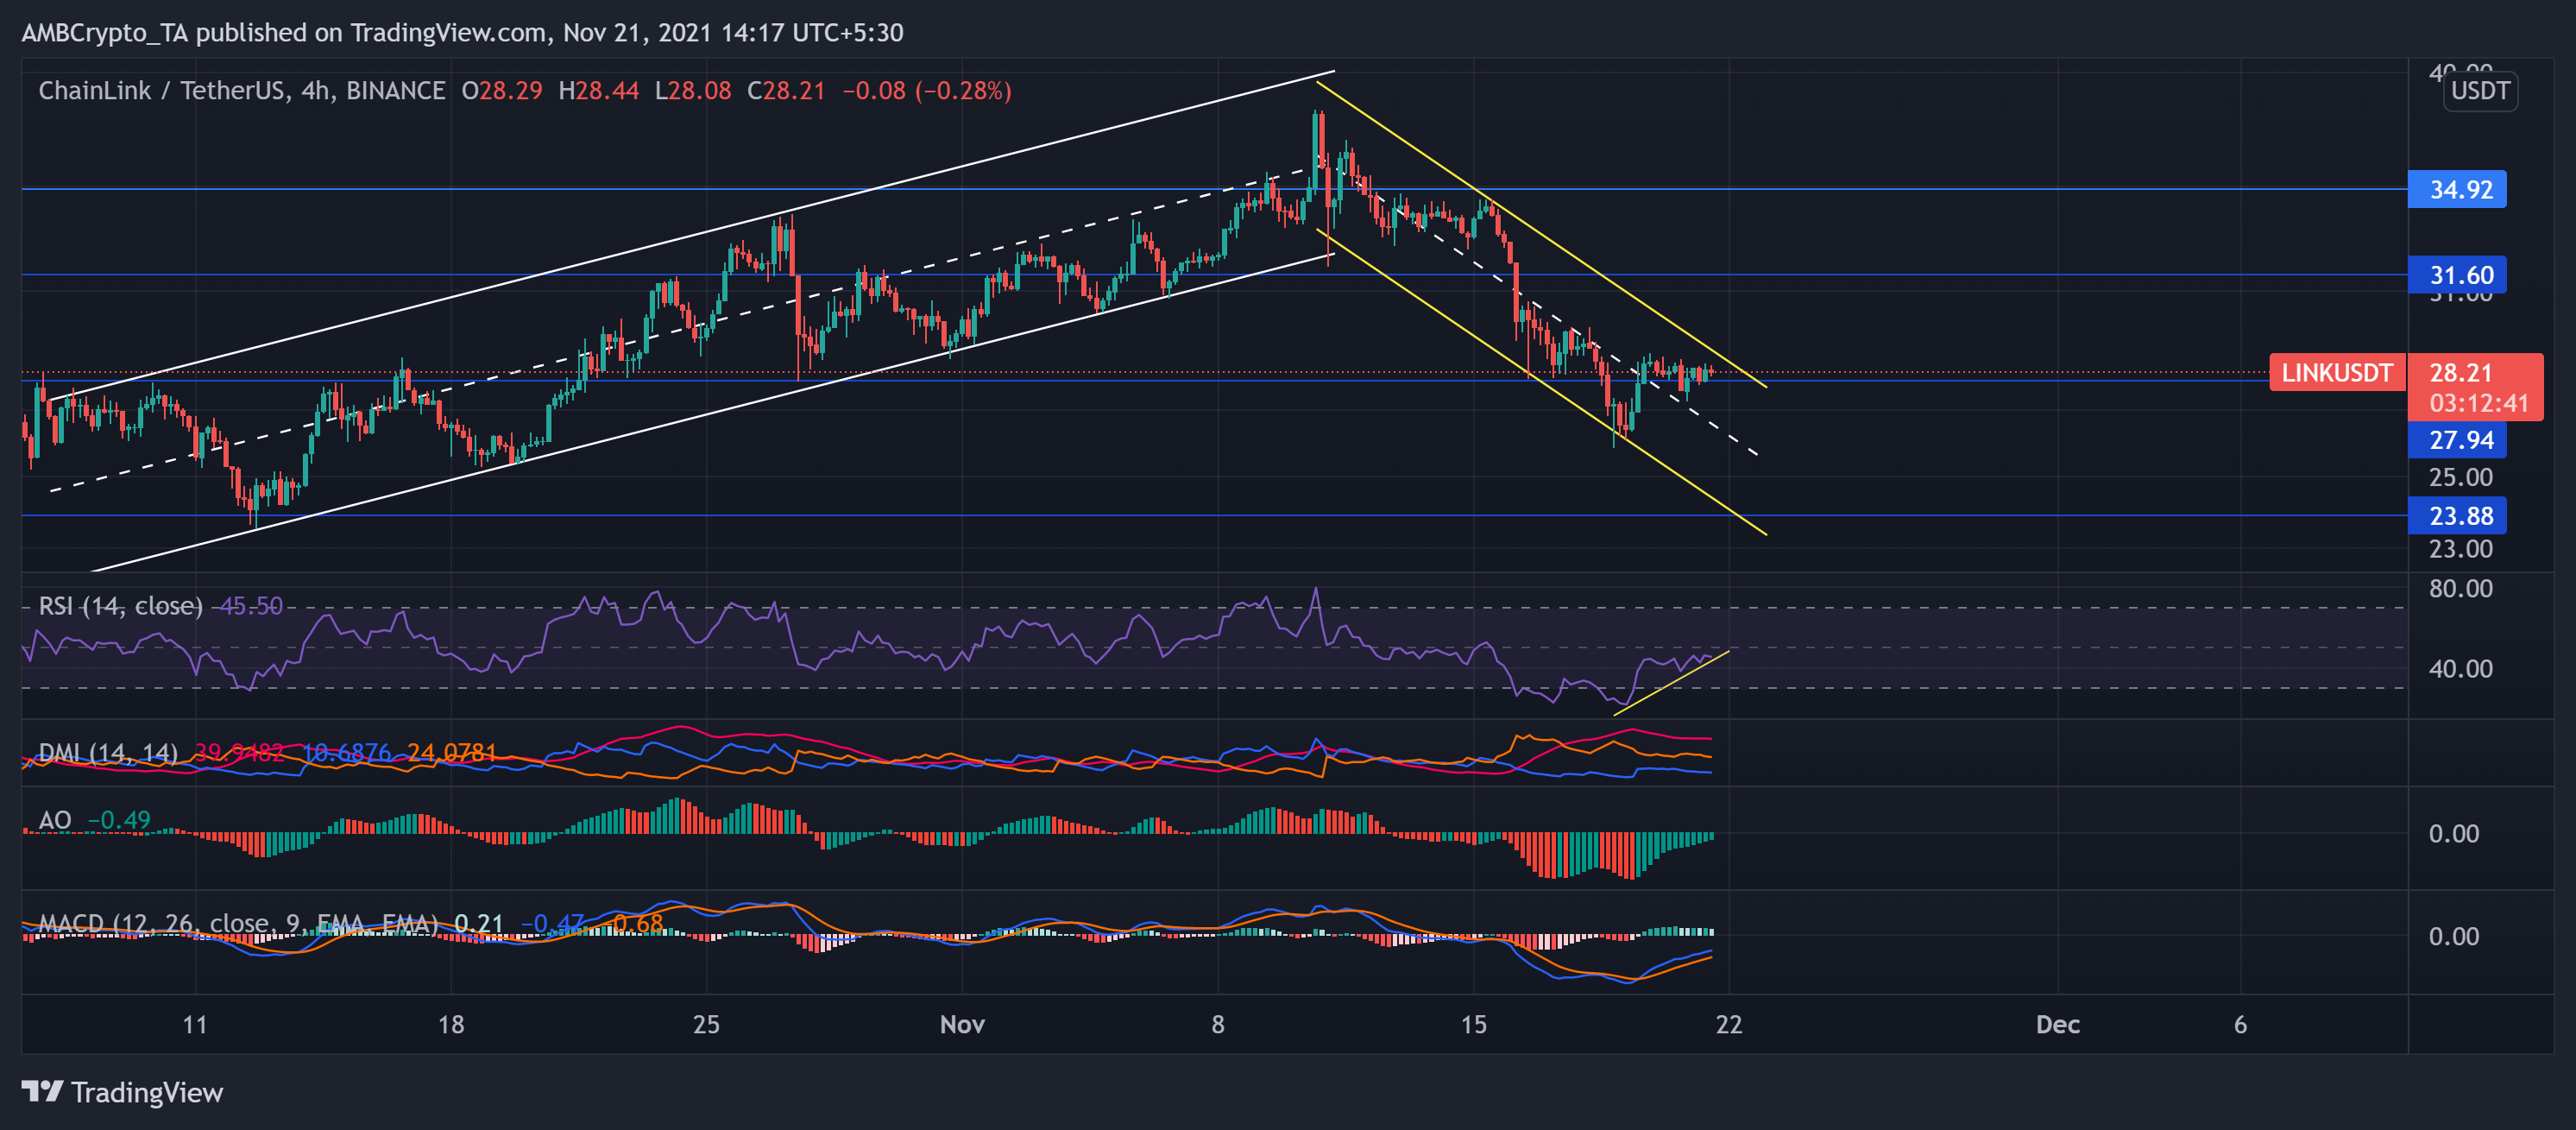
Like most cryptos, LINK marked a delightful October as the price firmly rose between the up channel. The alt registered an amazing 62.08% ROI from 12 October to 10 November. With this, the bulls successfully attained a six-month milestone on 10 November at $38.31.
However, the bears instantly challenged this achievement as the price downturned between the southern channel (yellow). During this sell-off phase, LINK lost over one-third of its value. The bears constantly breached new resistance levels to poke LINK’s one-month low on 18 November.
At press time, LINK traded at $28.21. The RSI was northbound after diving into the oversold region. Although the DMI preferred the bears, MACD and AO reaffirm RSI’s conclusion by depicting increasing bullish influence.
VeChain (VET)
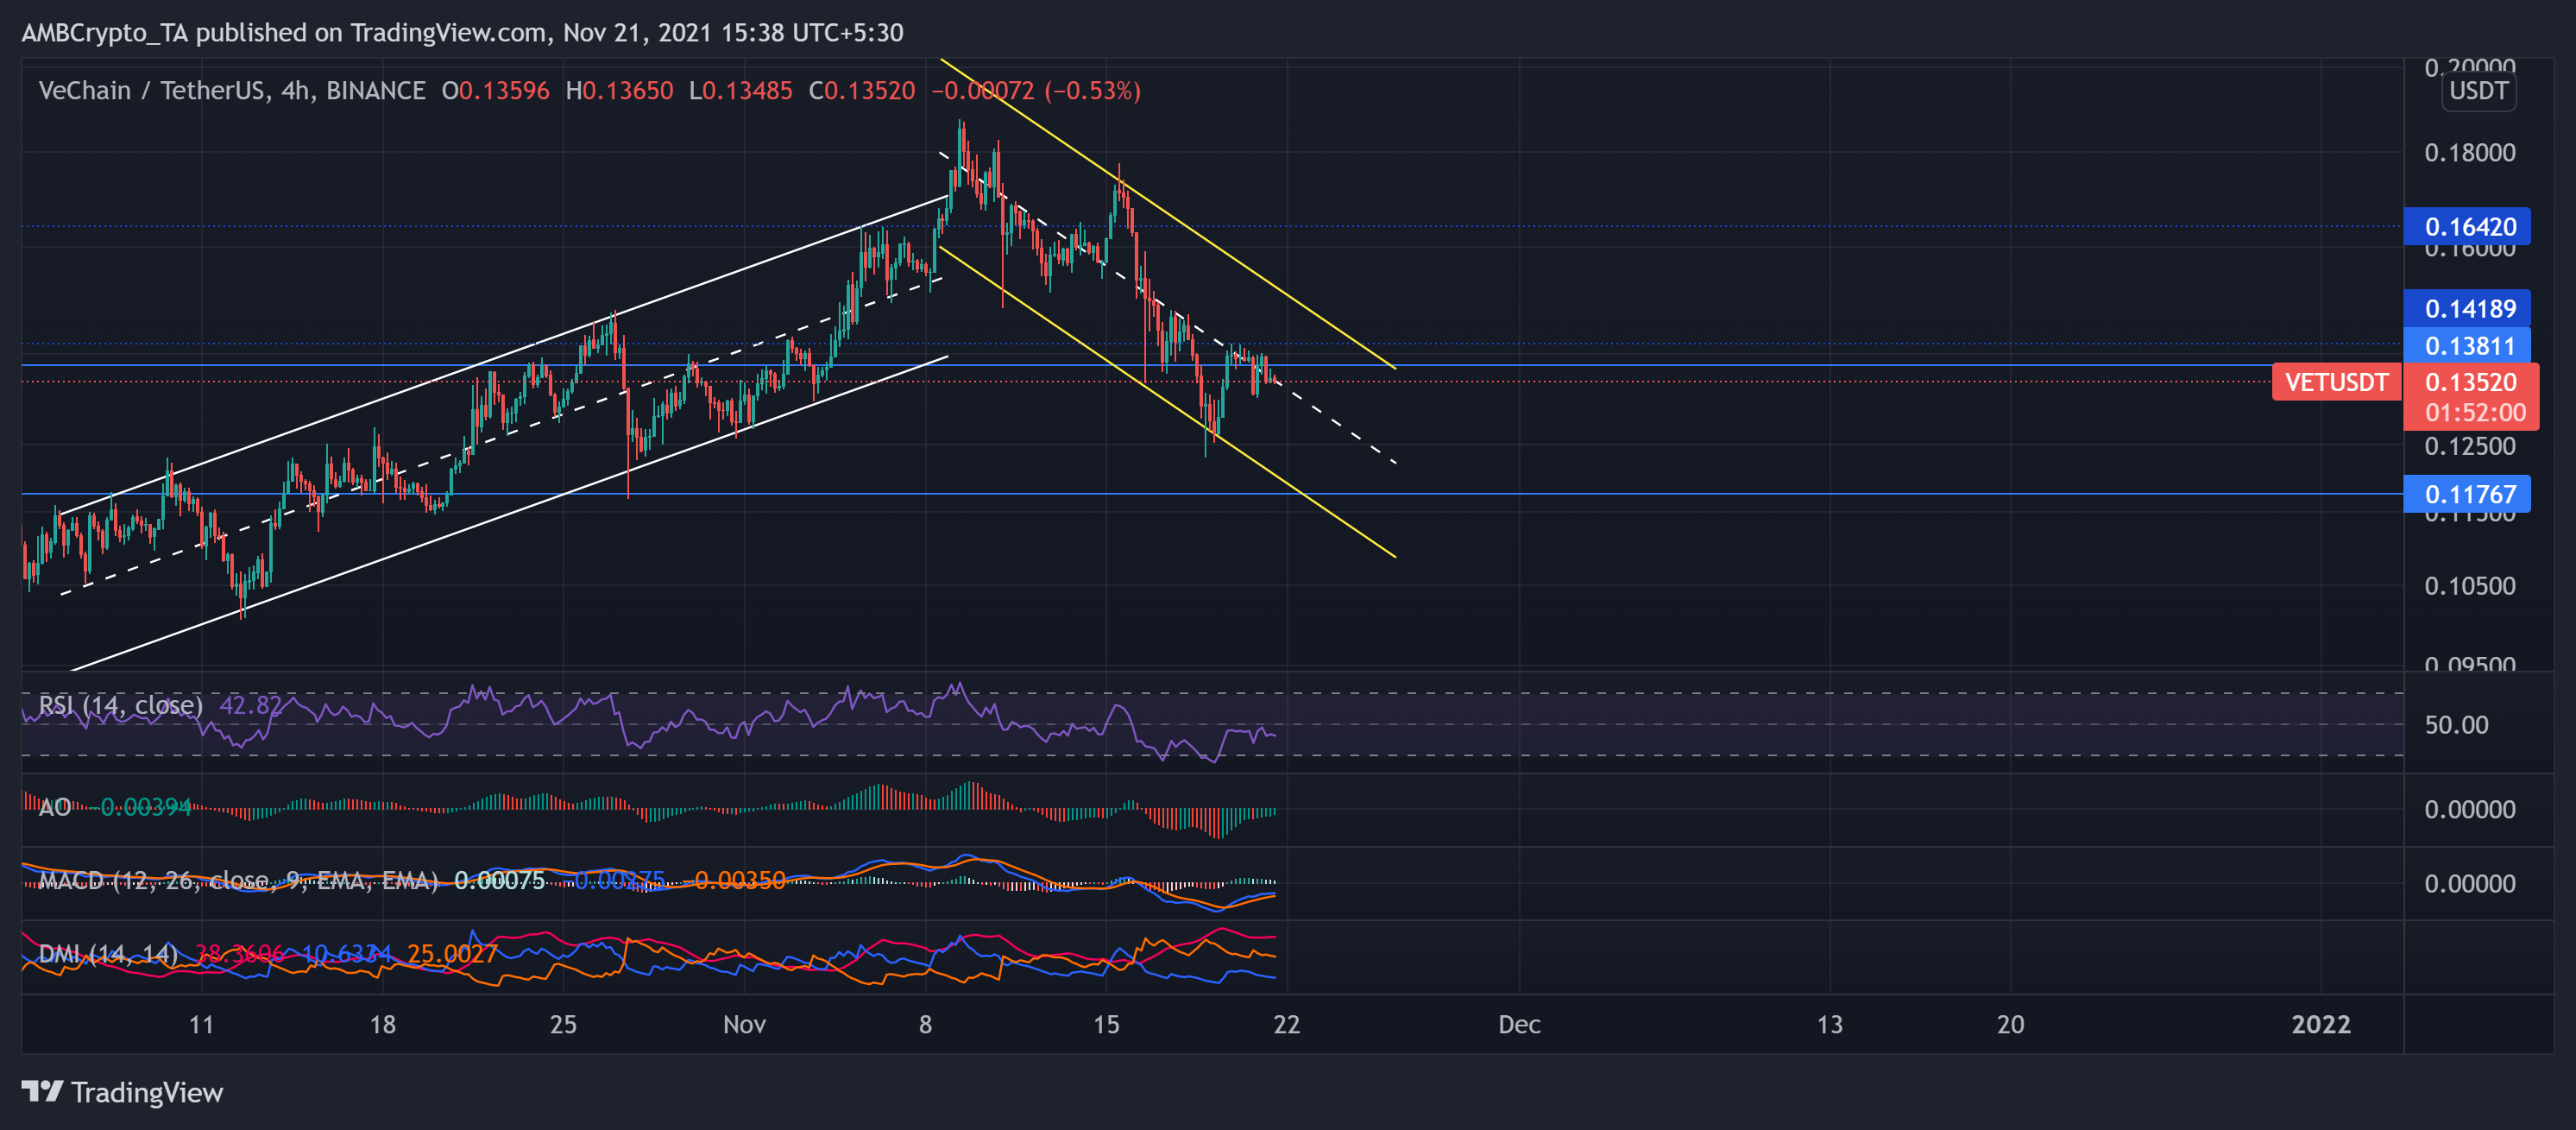
VET followed the market trend by enjoying a rallied October that extended onto early November. The price action oscillated between two parallel channels heading north. Since 1 October, the altcoin doubled its value to touch its six-month high on 9 November at $0.18755.
Since then, however, the alt witnessed a strong pullout as the price noted a 34.7% blip. As prices fell in a down channel (yellow), VET poked its three-week low on 18 November. Over the past three days, bulls attempted to trigger a rally but could not propel for long.
At press time, VET traded at $0.1352. The RSI skewed in favor of sellers. Although the DMI preferred the bears, MACD and AO depicted increasing bullish influence.


