Analysis

Should you HODL or sell? This is where MATIC could head in the coming week
Posted:
contributor

Polygon (MATIC) was on a steady uptrend as it formed a six-month-long rising wedge (yellow) and attained its ATH on 27 December. Since then, it saw a steep fall while falling below its 20-50-200 EMA.
Moving forward, MATIC looked to test the 61.8% Fibonacci support at the $1.5-mark and affirm the beginning of a downtrend for the alt. Investors need to keep a close watch on the 20 EMA (green). Any close above this level could result in a short-lived downtrend. At press time, MATIC traded at $1.602, down by 5.9% in the last 24 hours.
MATIC Daily Chart
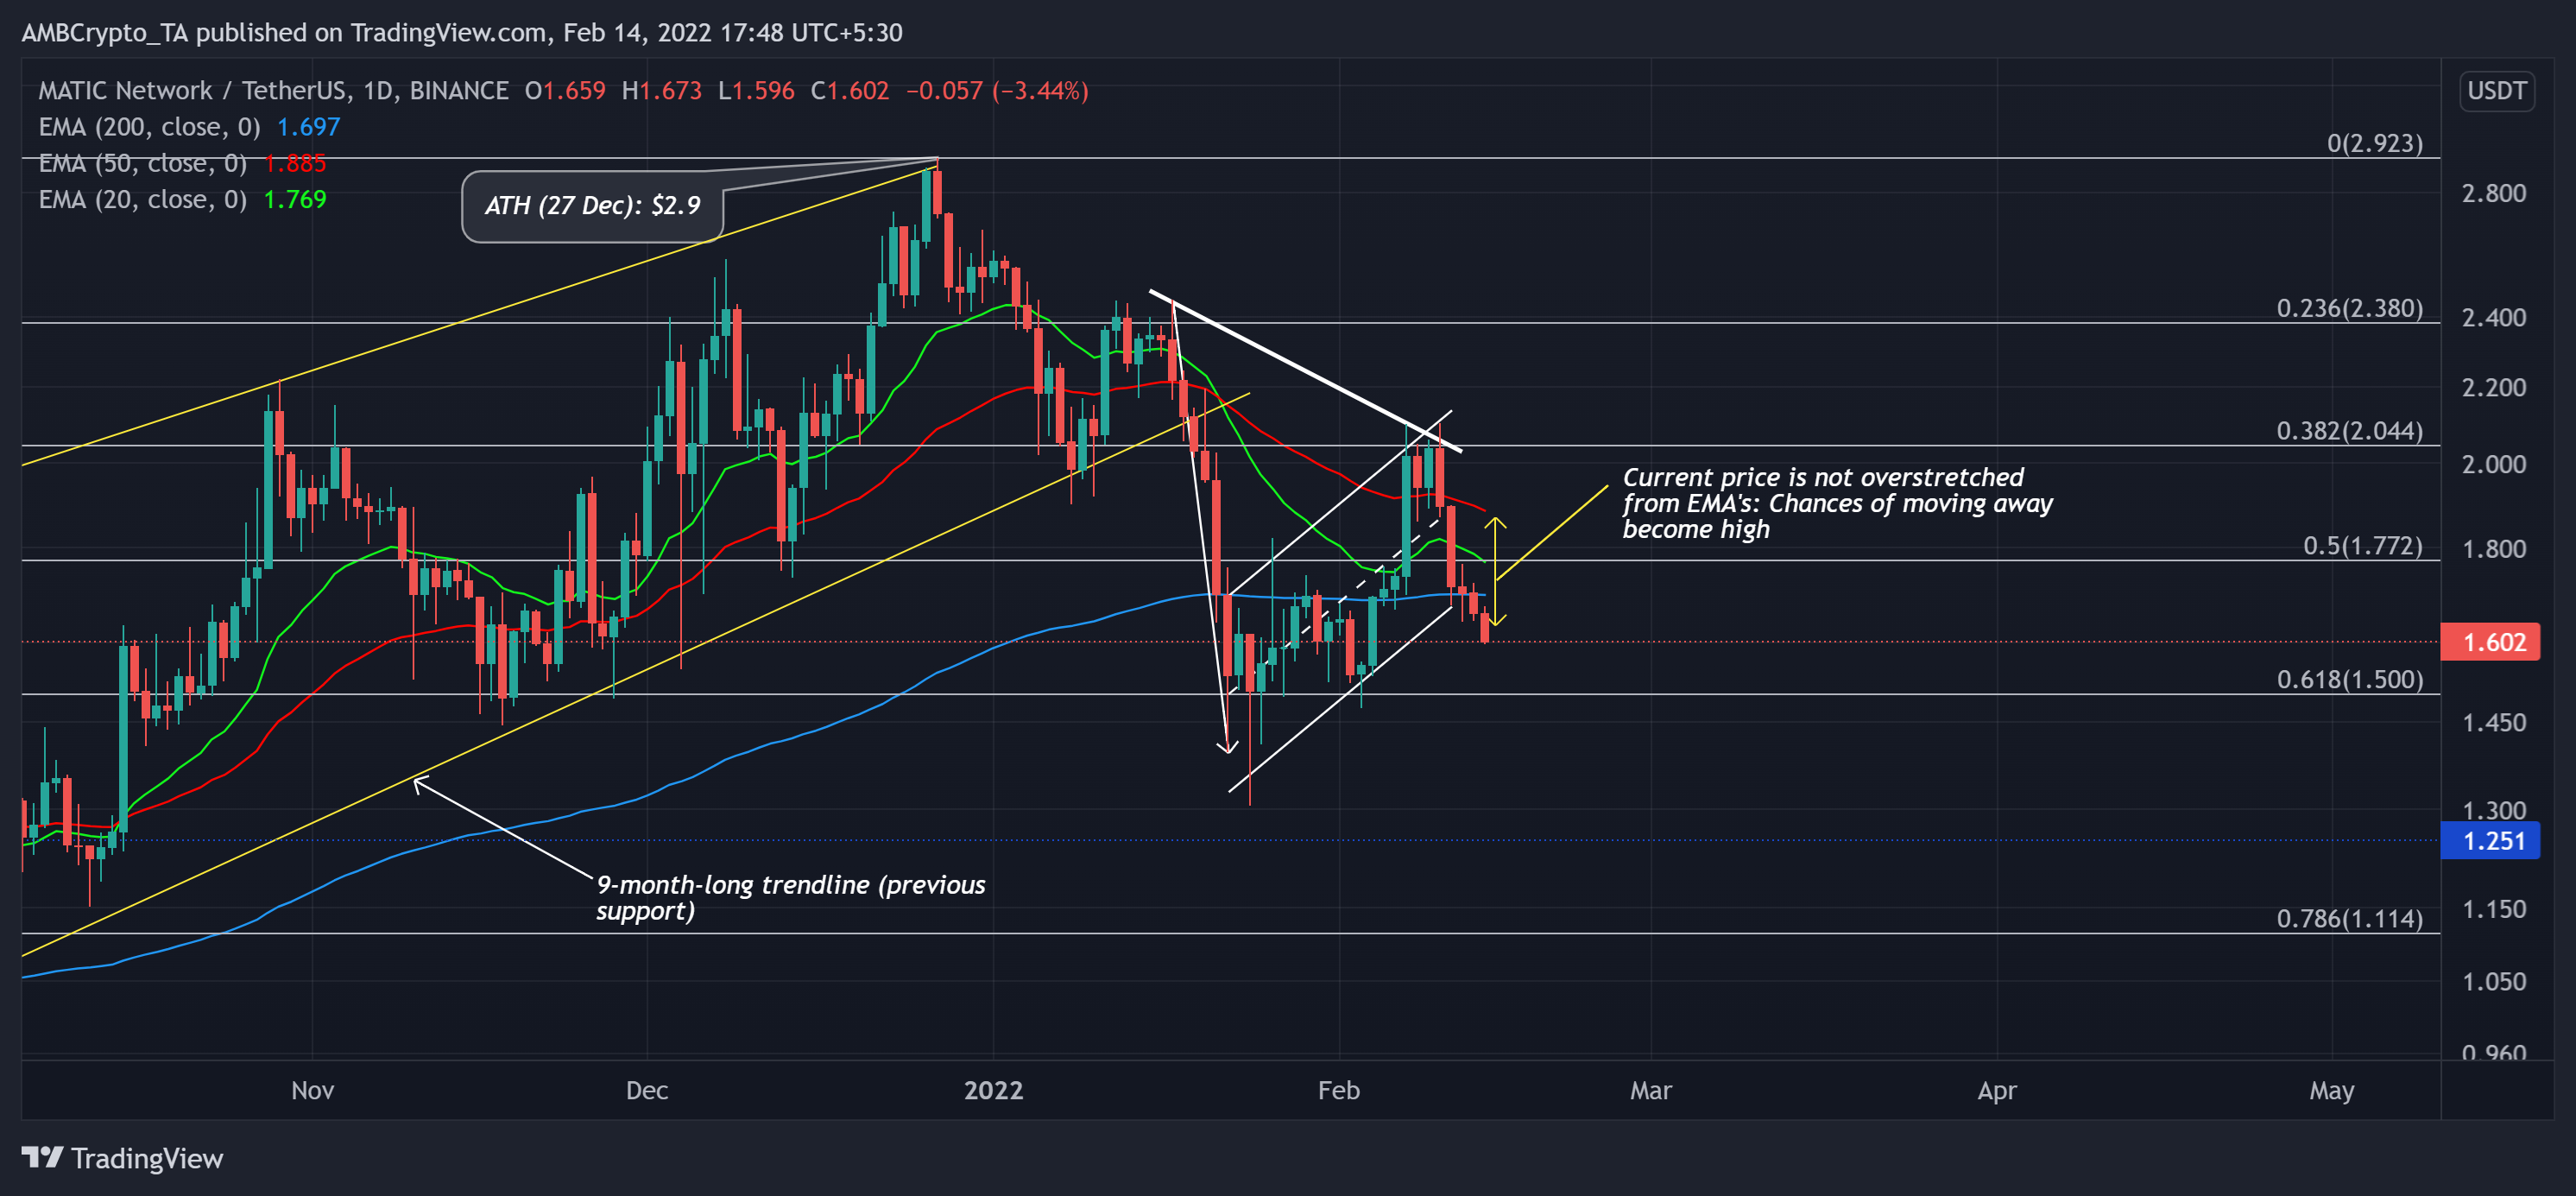
Source: TradingView, MATIC/USDT
Since its ATH, the alt tested its nine-month trendline (previous support) twice before snapping it to form a bearish flag on its daily chart. As a result, the price action fell below its 200 EMA (blue), depicting a possible start of a long-term downtrend.
After an over 50% fall (since its ATH), MATIC picked itself up from the 61.8% Fibonacci support only to face strong resistance at the $2-mark. With multiple bearish engulfing candlesticks in the past four days, the alt confirmed the bearish flag after breaking out of it and reaffirming the selling pressure.
While the current price is still not overstretched from its 20-50-200 EMA, the chances of a continued downtrend increase as it eyed to test the $1.5-level. This level would be a crucial zone for the buyers to step in and prevent a further drift toward the $1.2-mark. Moreover, the price fell below the 200 EMA for the first time since July 2021. Considering the weak readings on its technicals, there are slim chances for the alt to reverse the ongoing trajectory.
Rationale
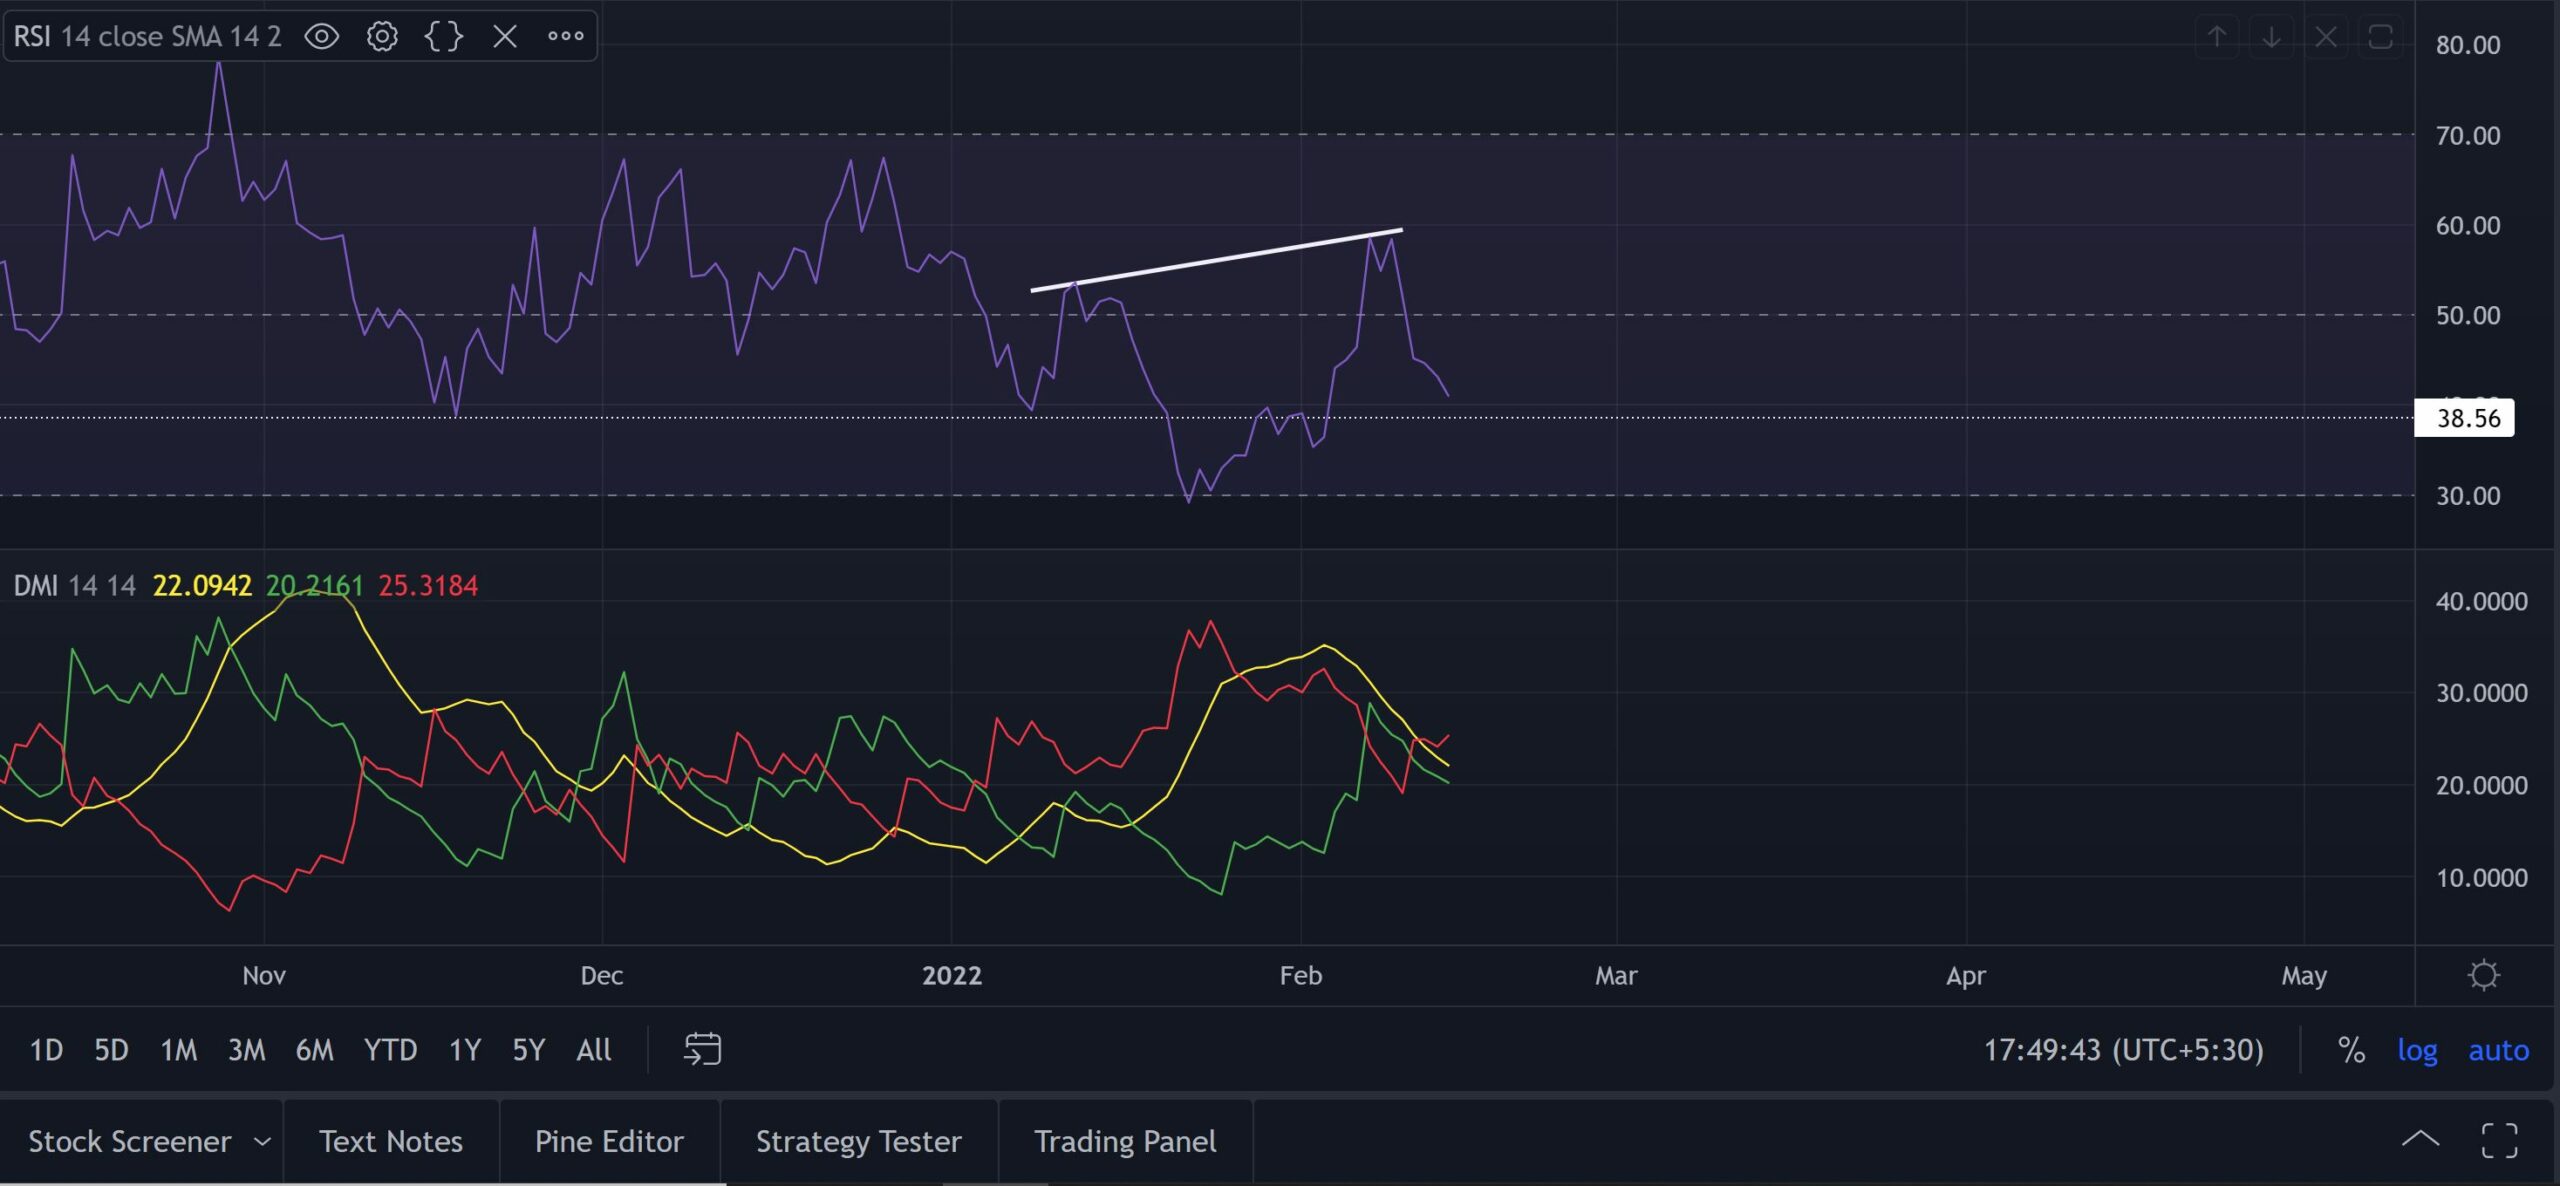
Source: TradingView, MATIC/USDT
The RSI lost its midline after forming a bearish divergence with price. It was southbound and aimed to retest the 38 mark. Furthermore, with the -DI looking north, the bears reaffirmed their vigor that would justify bearish movements in the coming days. But its ADX was on a downtrend while depicting a weak directional trend.
Conclusion
Keeping in mind the confluence created between aforestated factors, MATIC needed to brace itself for a continued downtrend. Any close below the golden Fibonacci level would propel a test of the $1.2-mark in the coming days. Nevertheless, the broader market sentiment should also be taken into account to make a profitable move.


![MANTRA [OM] price prediction - Traders, watch out for these retracement levels!](https://ambcrypto.com/wp-content/uploads/2024/11/Mantra-Featured-400x240.webp)