SOL faced rejection at the mid-range mark – is a move to $20.5 imminent?

Disclaimer: The information presented does not constitute financial, investment, trading, or other types of advice and is solely the writer’s opinion.
- Solana faced a sharp rejection at the range highs.
- A fall beneath $23.5 signified that another fall of 12% could follow.
Solana [SOL] performed extremely well in January when it recovered from $8 to reach $24 within weeks. In February, this bullish momentum stalled beneath a higher timeframe area of resistance at $27.
Is your portfolio green? Check the Solana Profit Calculator
SOL could not break out past $26 in the past two weeks. Bitcoin [BTC] also slid beneath the $23k level but found some buyers at the $22.4k mark. If BTC falls beneath $22.3k, it could drag many altcoins to lower prices.
A high-volume node and the mid-range present resistance to SOL
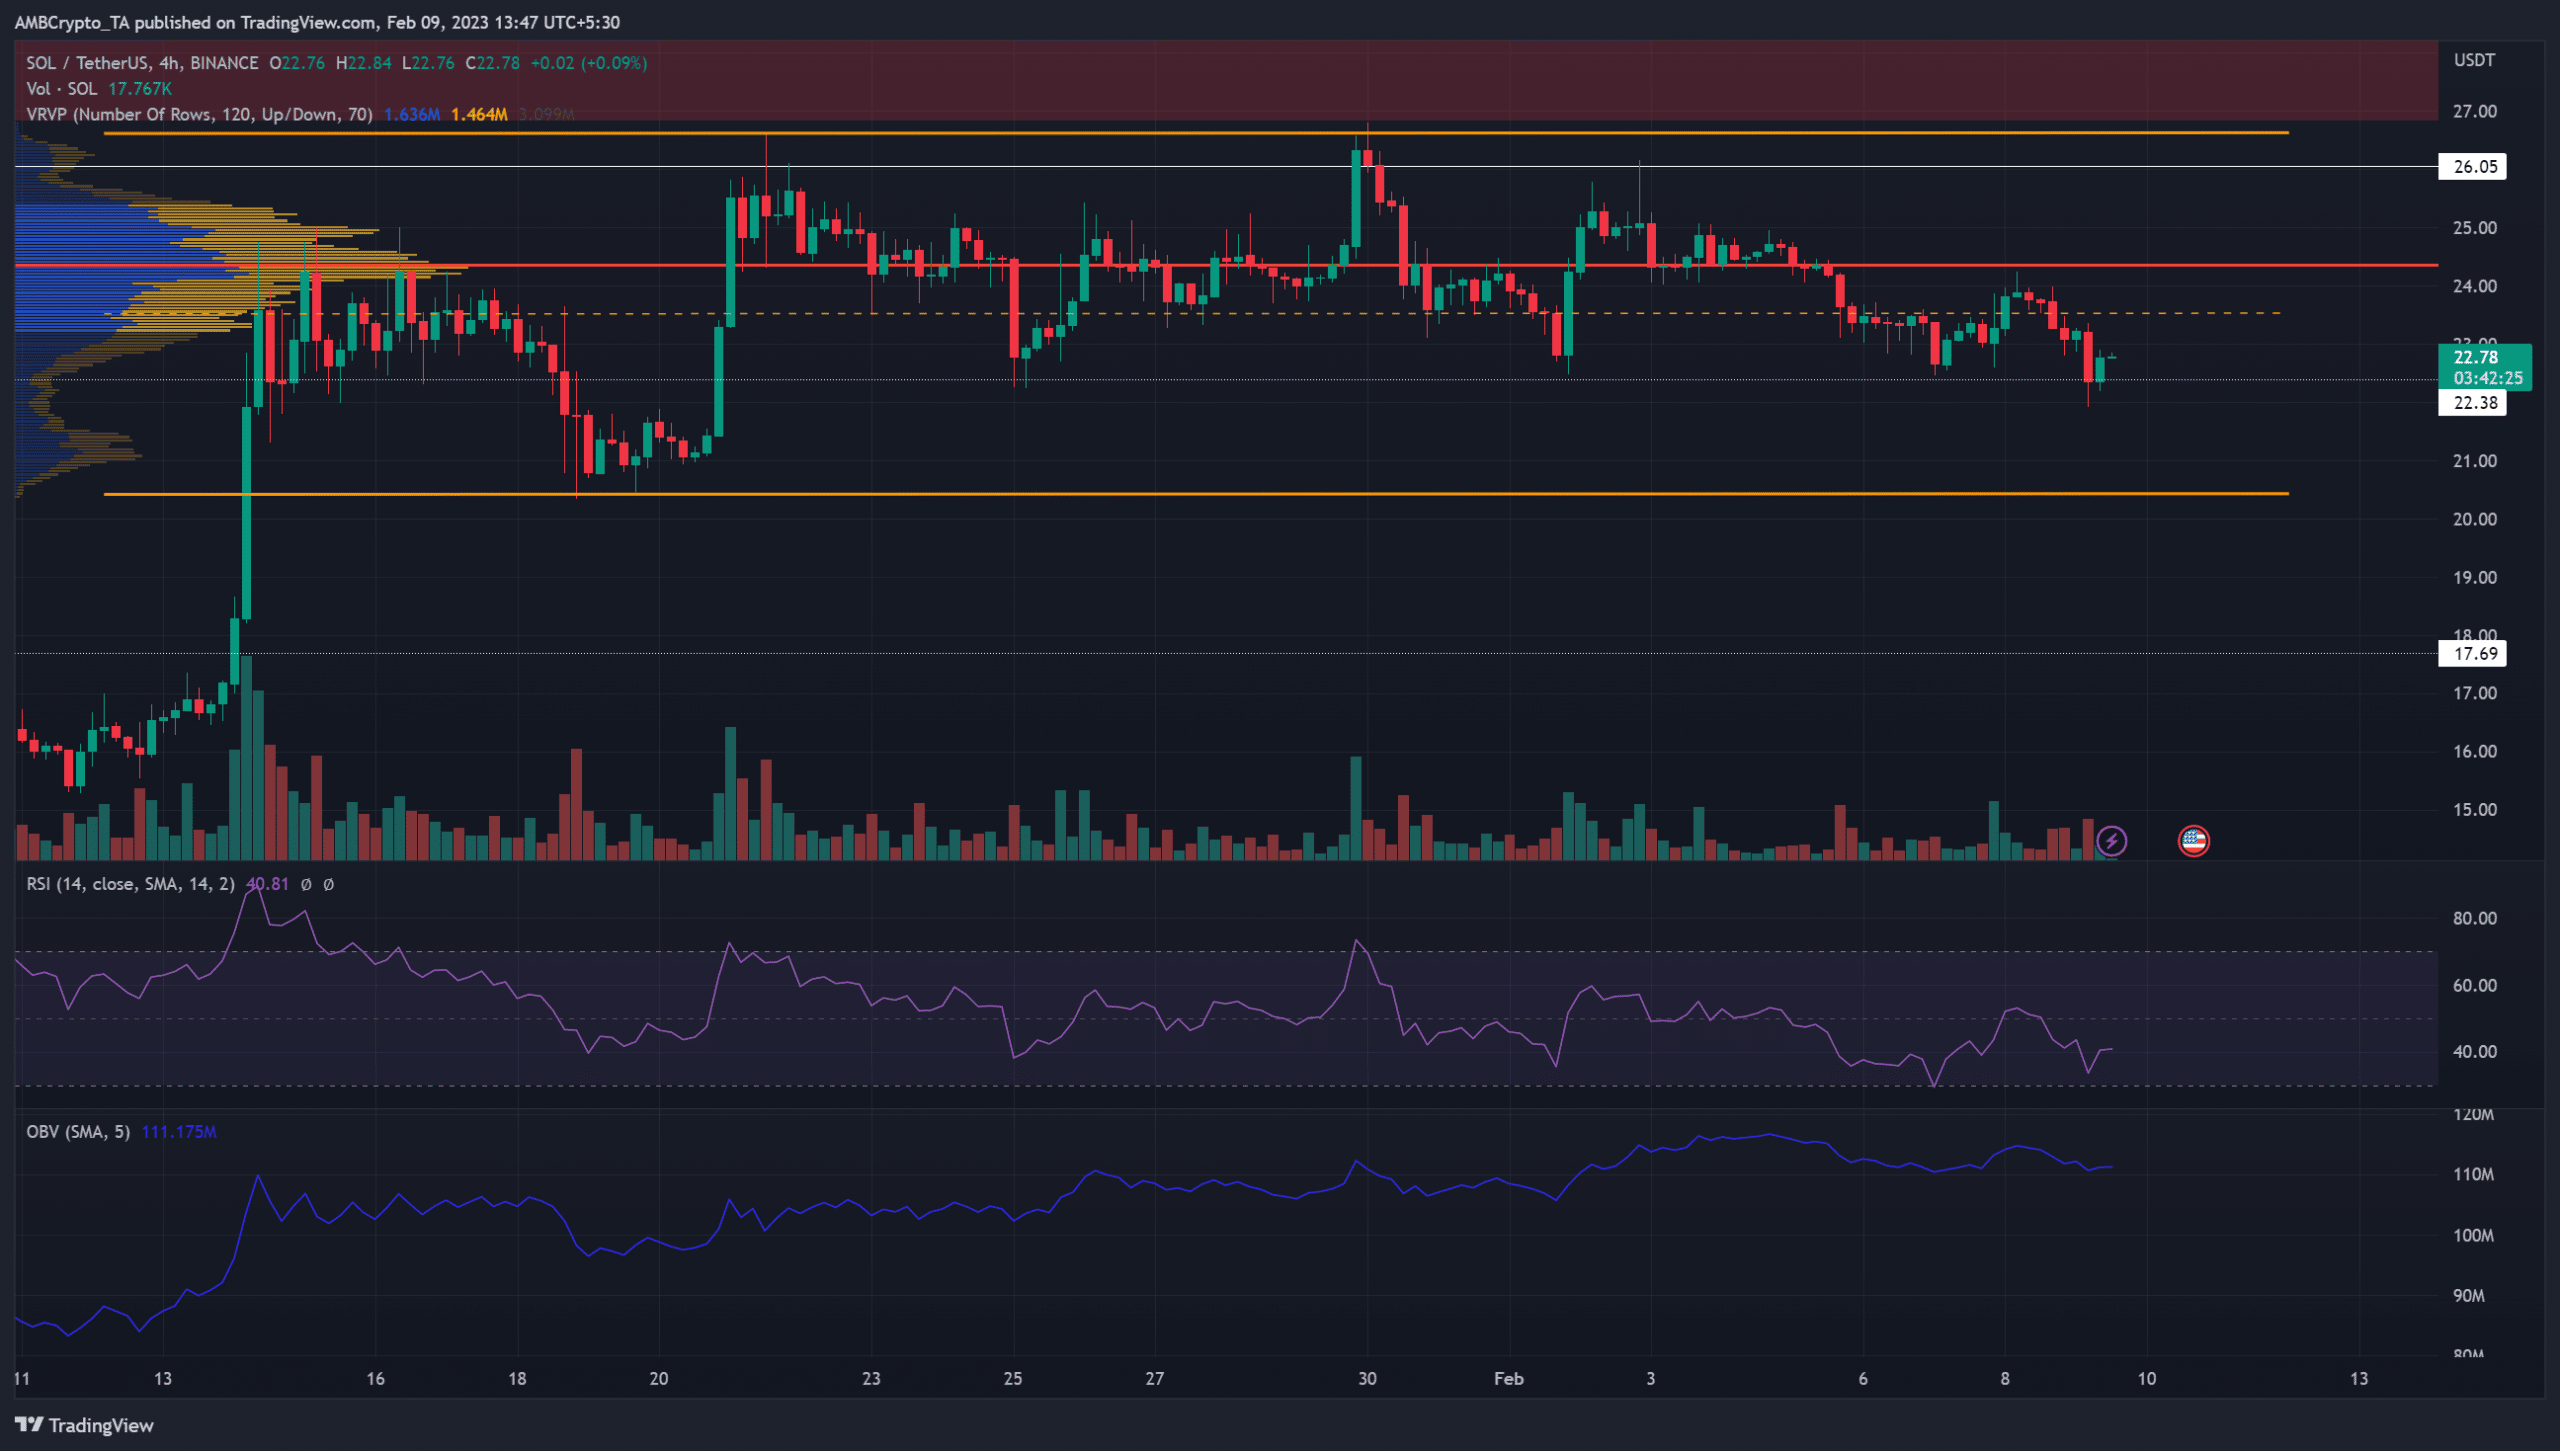
The Visible Range Volume Profile showed that the Point of Control (red) lay at $24.3. The price was trading beneath this point, which meant that SOL bulls could face significant resistance at this point in the coming days.
The mid-point of Solana’s range from mid-January also lay at $23.53, close to the high-volume node. Therefore, the inference was that the entire zone from $23.5-$24.3 presented stern resistance to the buyers.
A good risk-to-reward trade would be to buy SOL on a bullish reaction at the range lows at $20.47. A bullish engulfing pattern, or a bullish market structure break on the four-hour chart, could tip buyers of a shift in momentum.
How much are 1,10,100 SOL worth today?
Open Interest supported the idea of bearish sentiment
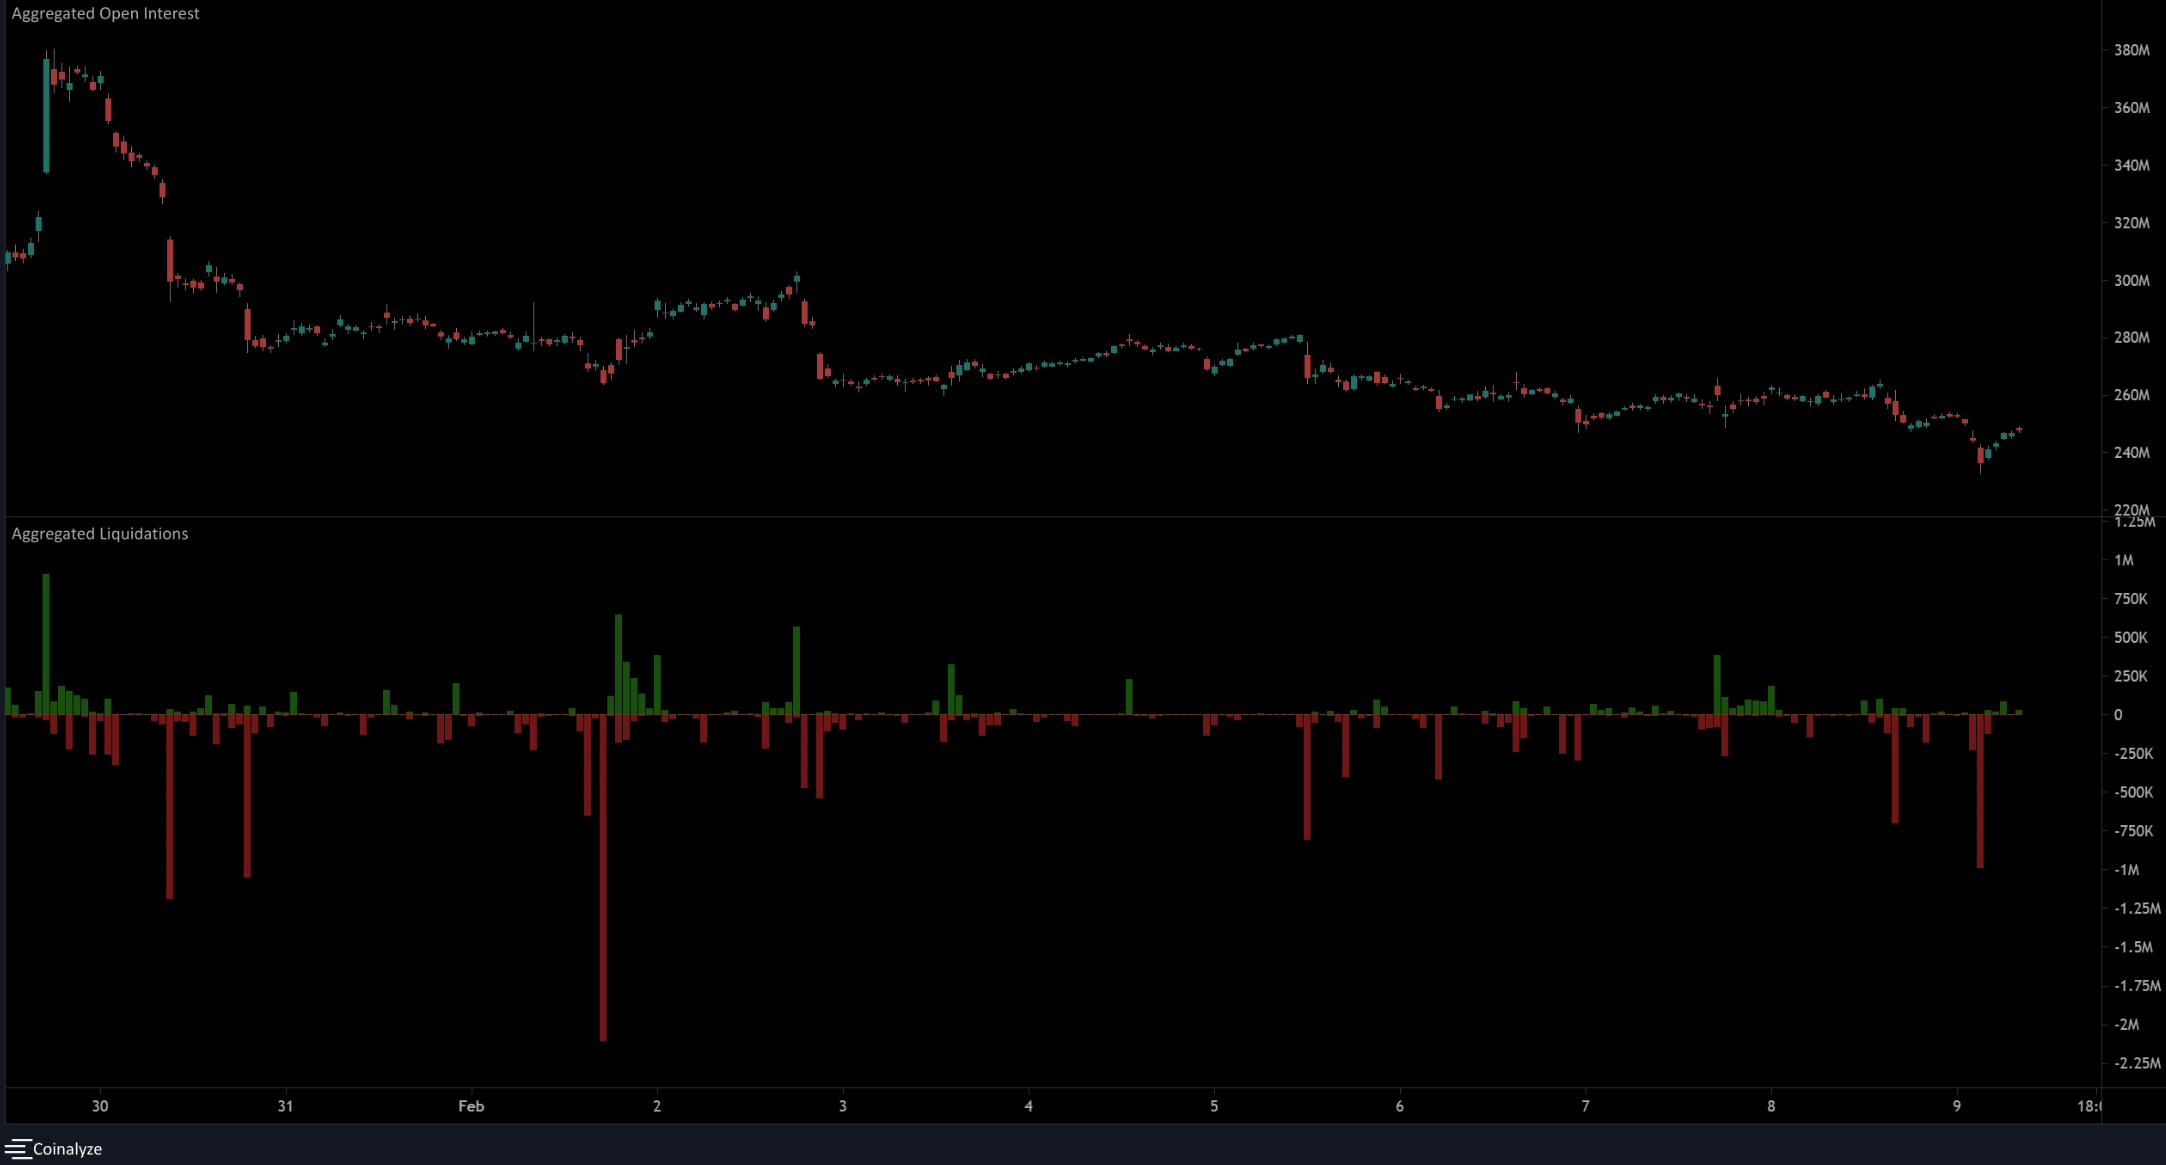
On 2 February, Solana retested the $26 level as resistance and saw a sharp rejection. The one-hour OI chart on 1 February showed a gradual move upward on the OI. This was followed by a sharp downward turn on 2 February.
In the past few days, one-hour trading sessions saw many more long positions (red) liquidated than short positions. Earlier on the day of writing, close to $1 million worth of long SOL positions were liquidated as the price fell below the $23 mark. Combined with the falling OI, the inference was discouraged longs and rising bearish sentiment.