Solana: A bullish rebound is possible at these price levels

Disclaimer: The findings of the following analysis are the sole opinions of the writer and should not be taken as investment advice
Bucking the broader market trend, Solana witnessed a 7% sell-off over the last 24 hours and eyed a third assault of its lower trendline. An extension of these losses would force a breakdown from SOL’s ascending channel and allow for a retest of $130.
Meanwhile, buyers will look for an early cut-off at $150 or at the 23.6% Fibonacci level. Oversold conditions on both the Bollinger Bands and RSI can allow investors to step in and bag SOL at a discounted price level.
Solana 4-hour Chart
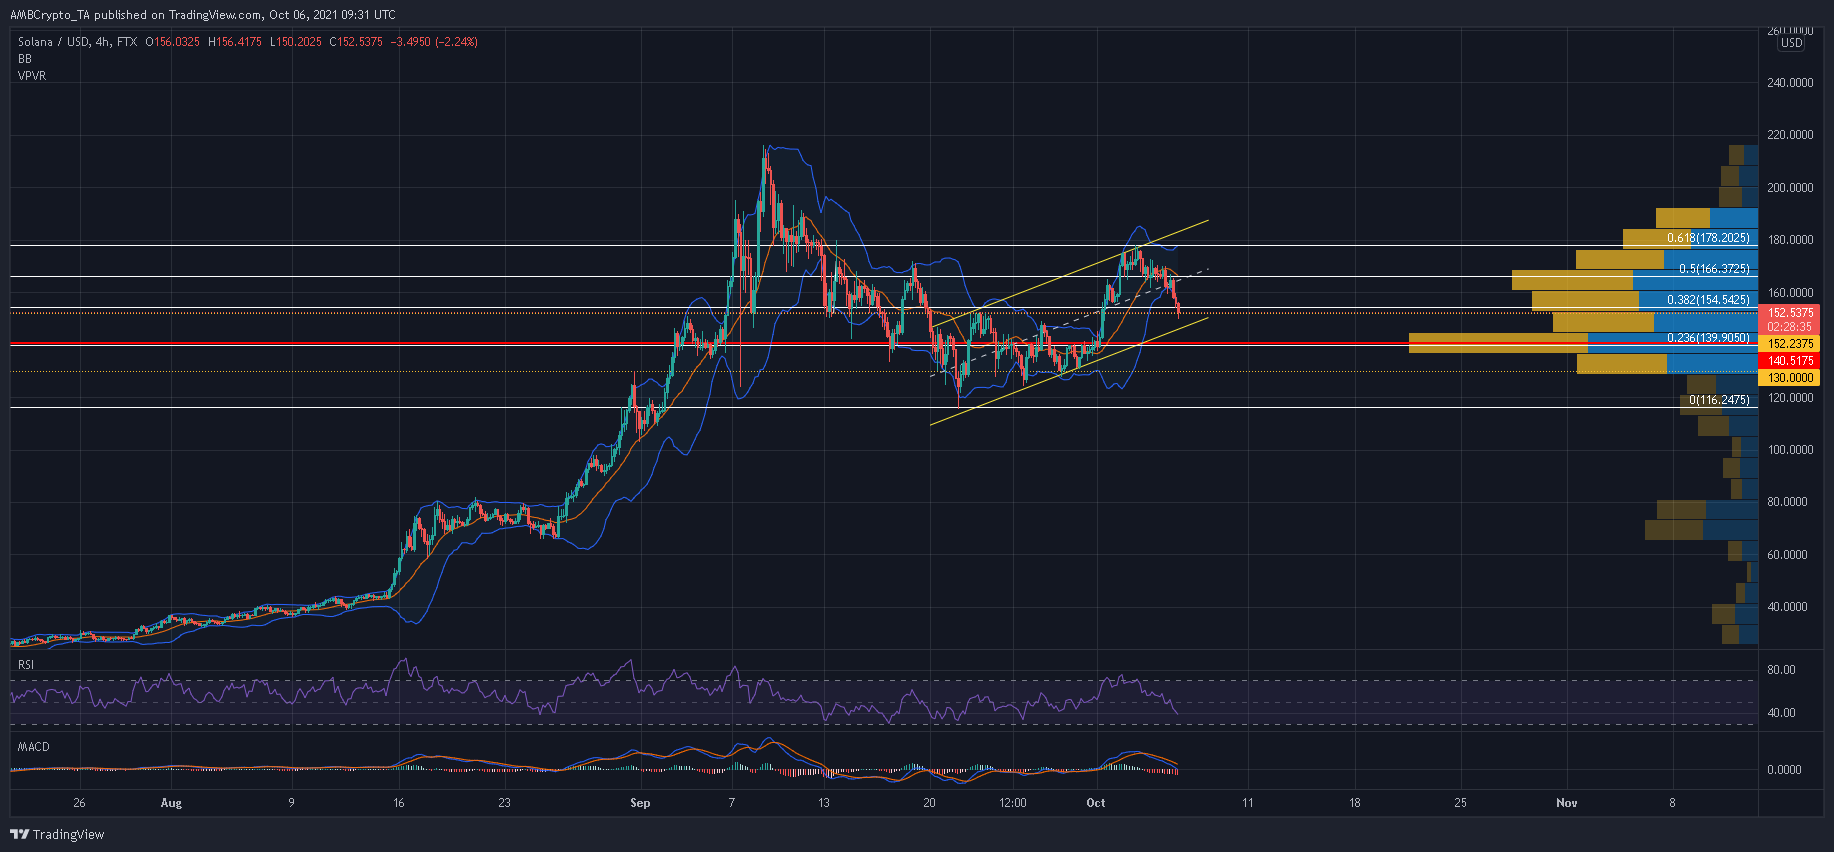
The lack of demand for SOL at its 61.8% Fibonacci level hurt its chances of progressing further on the chart. As investors locked in their gains at the aforementioned level, losses in the SOL market amounted to 16% over the last three days.
At this rate, a third attack on the lower trendline looked imminent with bears having the upper hand for an up-channel breakdown. A close below the lower trendline could drag SOL all the way to its 21 September swing low of $116.2. Overall, this represented a 22% sell-off from SOL’s press time level.
On the other hand, buyers can trigger a response at the 23.6% Fibonacci level- A region that also coincided with the Visible Range’s POC. A defensive region at $130 would also allow bulls to mount a counterattack.
Reasoning
Interestingly, SOL’s candles were trading below the lower end of the Bollinger Bands. Such a development usually triggers a response from buyers who hunt for discounted opportunities in the market. Moreover, the RSI was also close to oversold levels and a near-term reversal looked likely.
This made the 23.6% Fibonacci level and $130 support more attractive should SOL move south from its pattern. However, the MACD’s trajectory was concerning. A shift below the mid-line could generate some more selling pressure before a bullish response.
Conclusion
SOL threatened another 22% sell-off in case of an up-channel breakdown. However, expect bulls to be stubborn at the 23.6% Fibonacci level and the $130-support, especially since oversold readings on both the Bollinger Bands and RSI presented chances of an immediate reversal.
If so, SOL could make its way back to the 50% Fibonacci level and look to push higher.


