Solana, Avalanche, AAVE Price Analysis: 05 October
Most altcoins in the market, at press time, were trading laterally with minor losses or gains on their respective charts. The likes of Solana and Avalanche fell on their charts too.
Solana was trading near its immediate support line with a somewhat bullish outlook. Avalanche saw buying pressure exit its market, following which the altcoin dipped by 1.4%.
Aave, however, moved up the charts over the last 24 hours and could attempt to break above its immediate price ceiling over the next few trading sessions.
Solana [SOL]
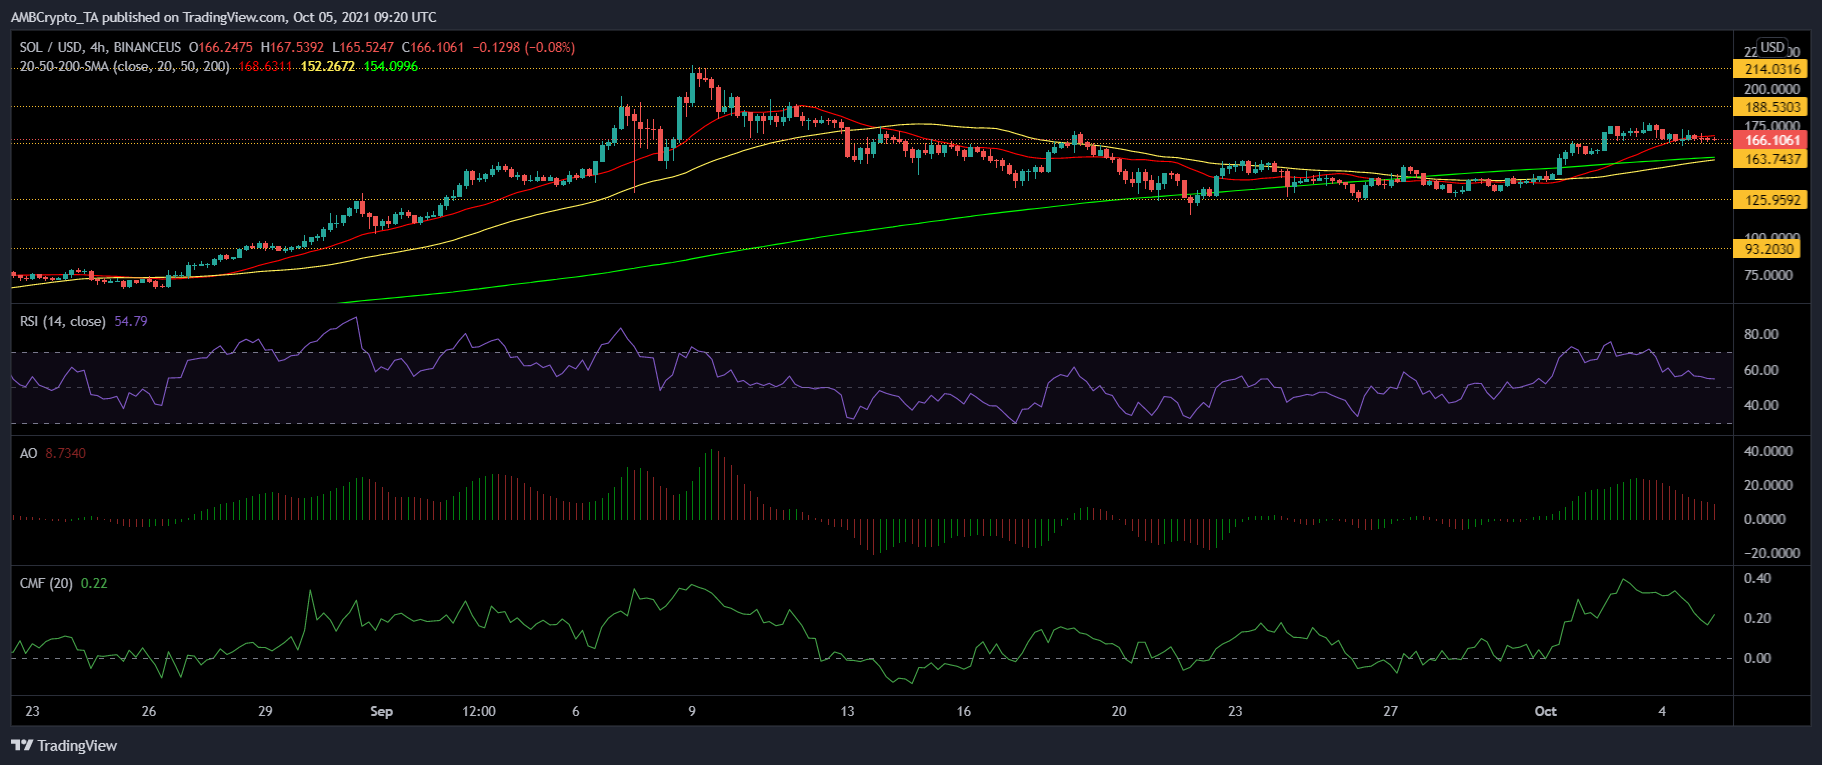
Solana was seen consolidating on its charts after recording a minor loss of 0.4% over the last 24 hours. The alt was available for $166.10. SOL was trading close to its support line of $163.74 and it could dip below that level with more consolidation over the next few trading sessions. Other additional price floors rested at $125.95 and then at $93.20 – A level SOL last touched over a month ago.
On the four-hour chart, the price of the token was positioned below the 20-SMA line, indicating that price momentum was in favor of the sellers. The Awesome Oscillator pictured red signal bars.
The Relative Strength Index noted a fall as the indicator fell below the 60-mark. However, buying strength hadn’t completely fizzled out. The Chaikin Money Flow also noted an uptick as capital inflows were positive.
In case buying pressure continues to remain positive, the altcoin could attempt to break consolidation on the upside. The resistance levels for the coin awaited at $188.53 and then, at $214.03.
Avalanche [AVAX]
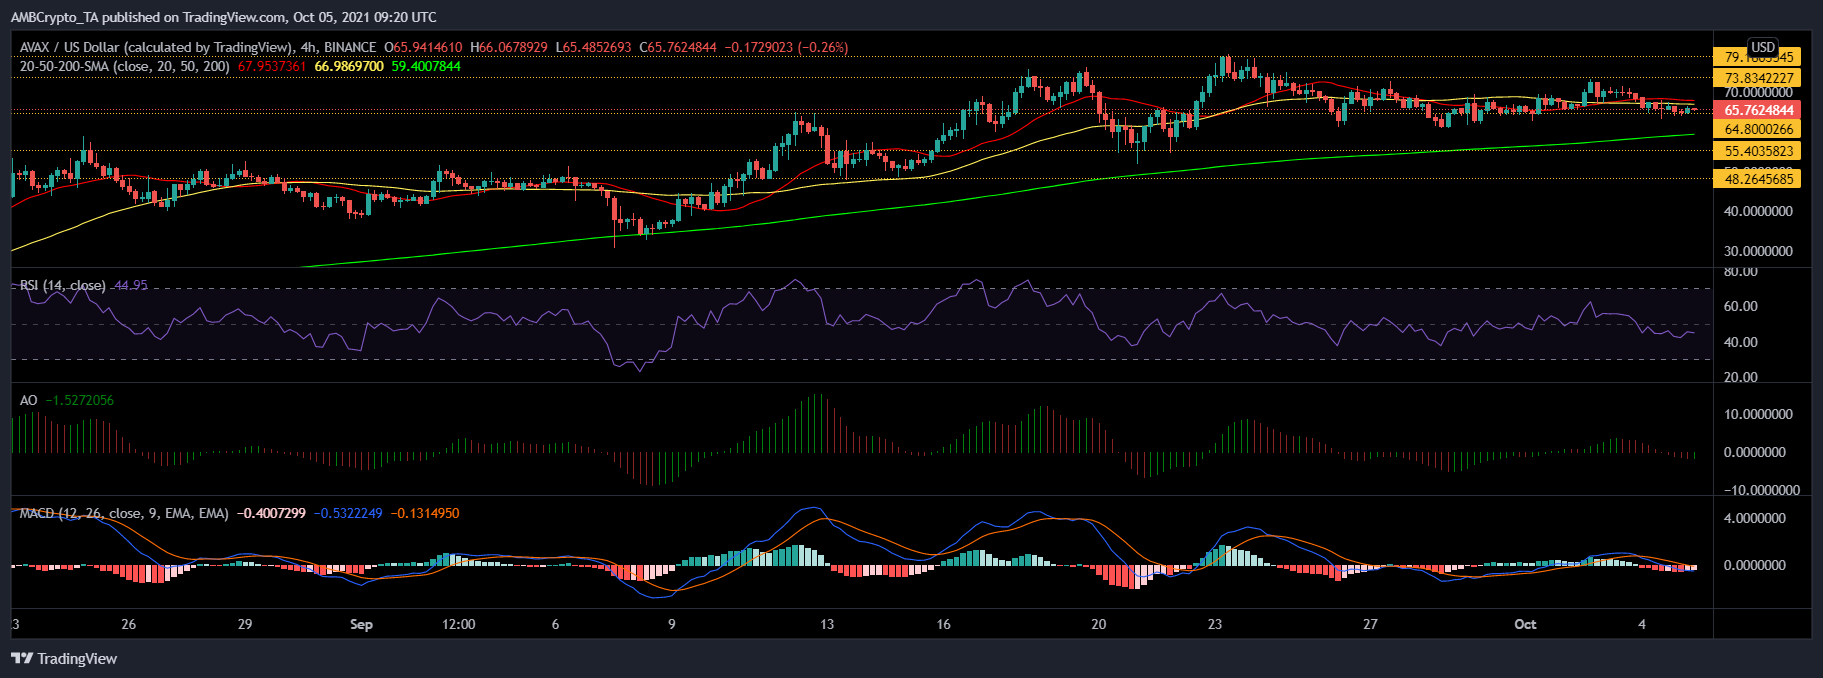
Avalanche was trading at $65.76 after it declined by 1.4% over the last 24 hours. Key technical indicators for the altcoin pointed to bearishness in the market. The closest support line for the altcoin was at $64.80. The other levels where AVAX could find itself on would be $55.40 and then, $48.26.
The four-hour 20-SMA line was above the candlestick. This hinted at price momentum being in inclination towards the sellers.
The Relative Strength Index was below the 50-mark. This suggested weakness in buying strength. The MACD noted red histograms with a crossover into bearish territory. The Awesome Oscillator, after series of red signal bars, displayed one green signal bar.
A price reversal could cause AVAX to revisit its one-week high price of $73.83, before aiming for $79.70.
AAVE
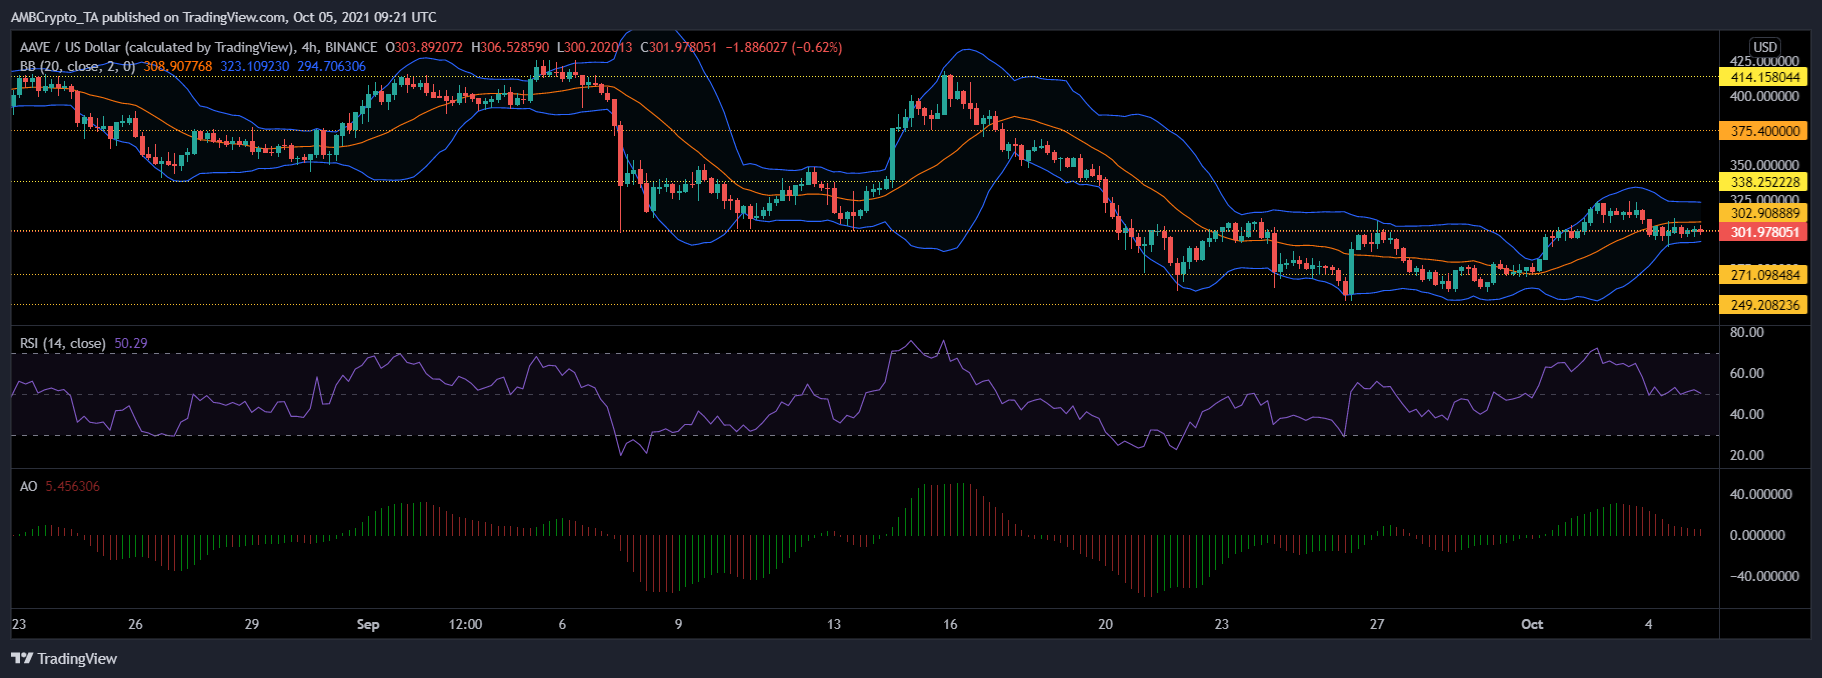
Aave was seen trading in the green with a slight appreciation of 1.4% over the last 24 hours. The altcoin was trading at $301.97. The immediate overhead resistance that Aave could attempt to topple over was $302.90. The other price ceilings stood at $338.25 and $375.40. Despite a minor uptick in the price, the outlook for the crypto remained bearish.
The Awesome Oscillator was seen flashing red signal bars. The Relative Strength Index threatened to fall below the half-line, suggestive of a decline in the strength of buyers in the market.
Finally, the Bollinger Bands were parallel – A sign of low price volatility.
If Aave continues to trade laterally, it could fall over the next few trading sessions. If so, the support levels for the altcoin could be found at $271.09 and at its one-week low of $249.20.


