Solana, Axie Infinity, Aave Price Analysis: 31 January

As Bitcoin fell under its 4-hour 20-SMA, Solana marked an expected bearish pennant breakdown. Axie Infinity still struggled to topple the $54-mark while its OBV depicted a bearish bias. Furthermore, AAVE also witnessed a bearish pattern after recovering from the $139-mark. All the aforestated cryptos revealed a weak RSI as the bears kept the ‘fear’ sentiment intact.
Solana (SOL)
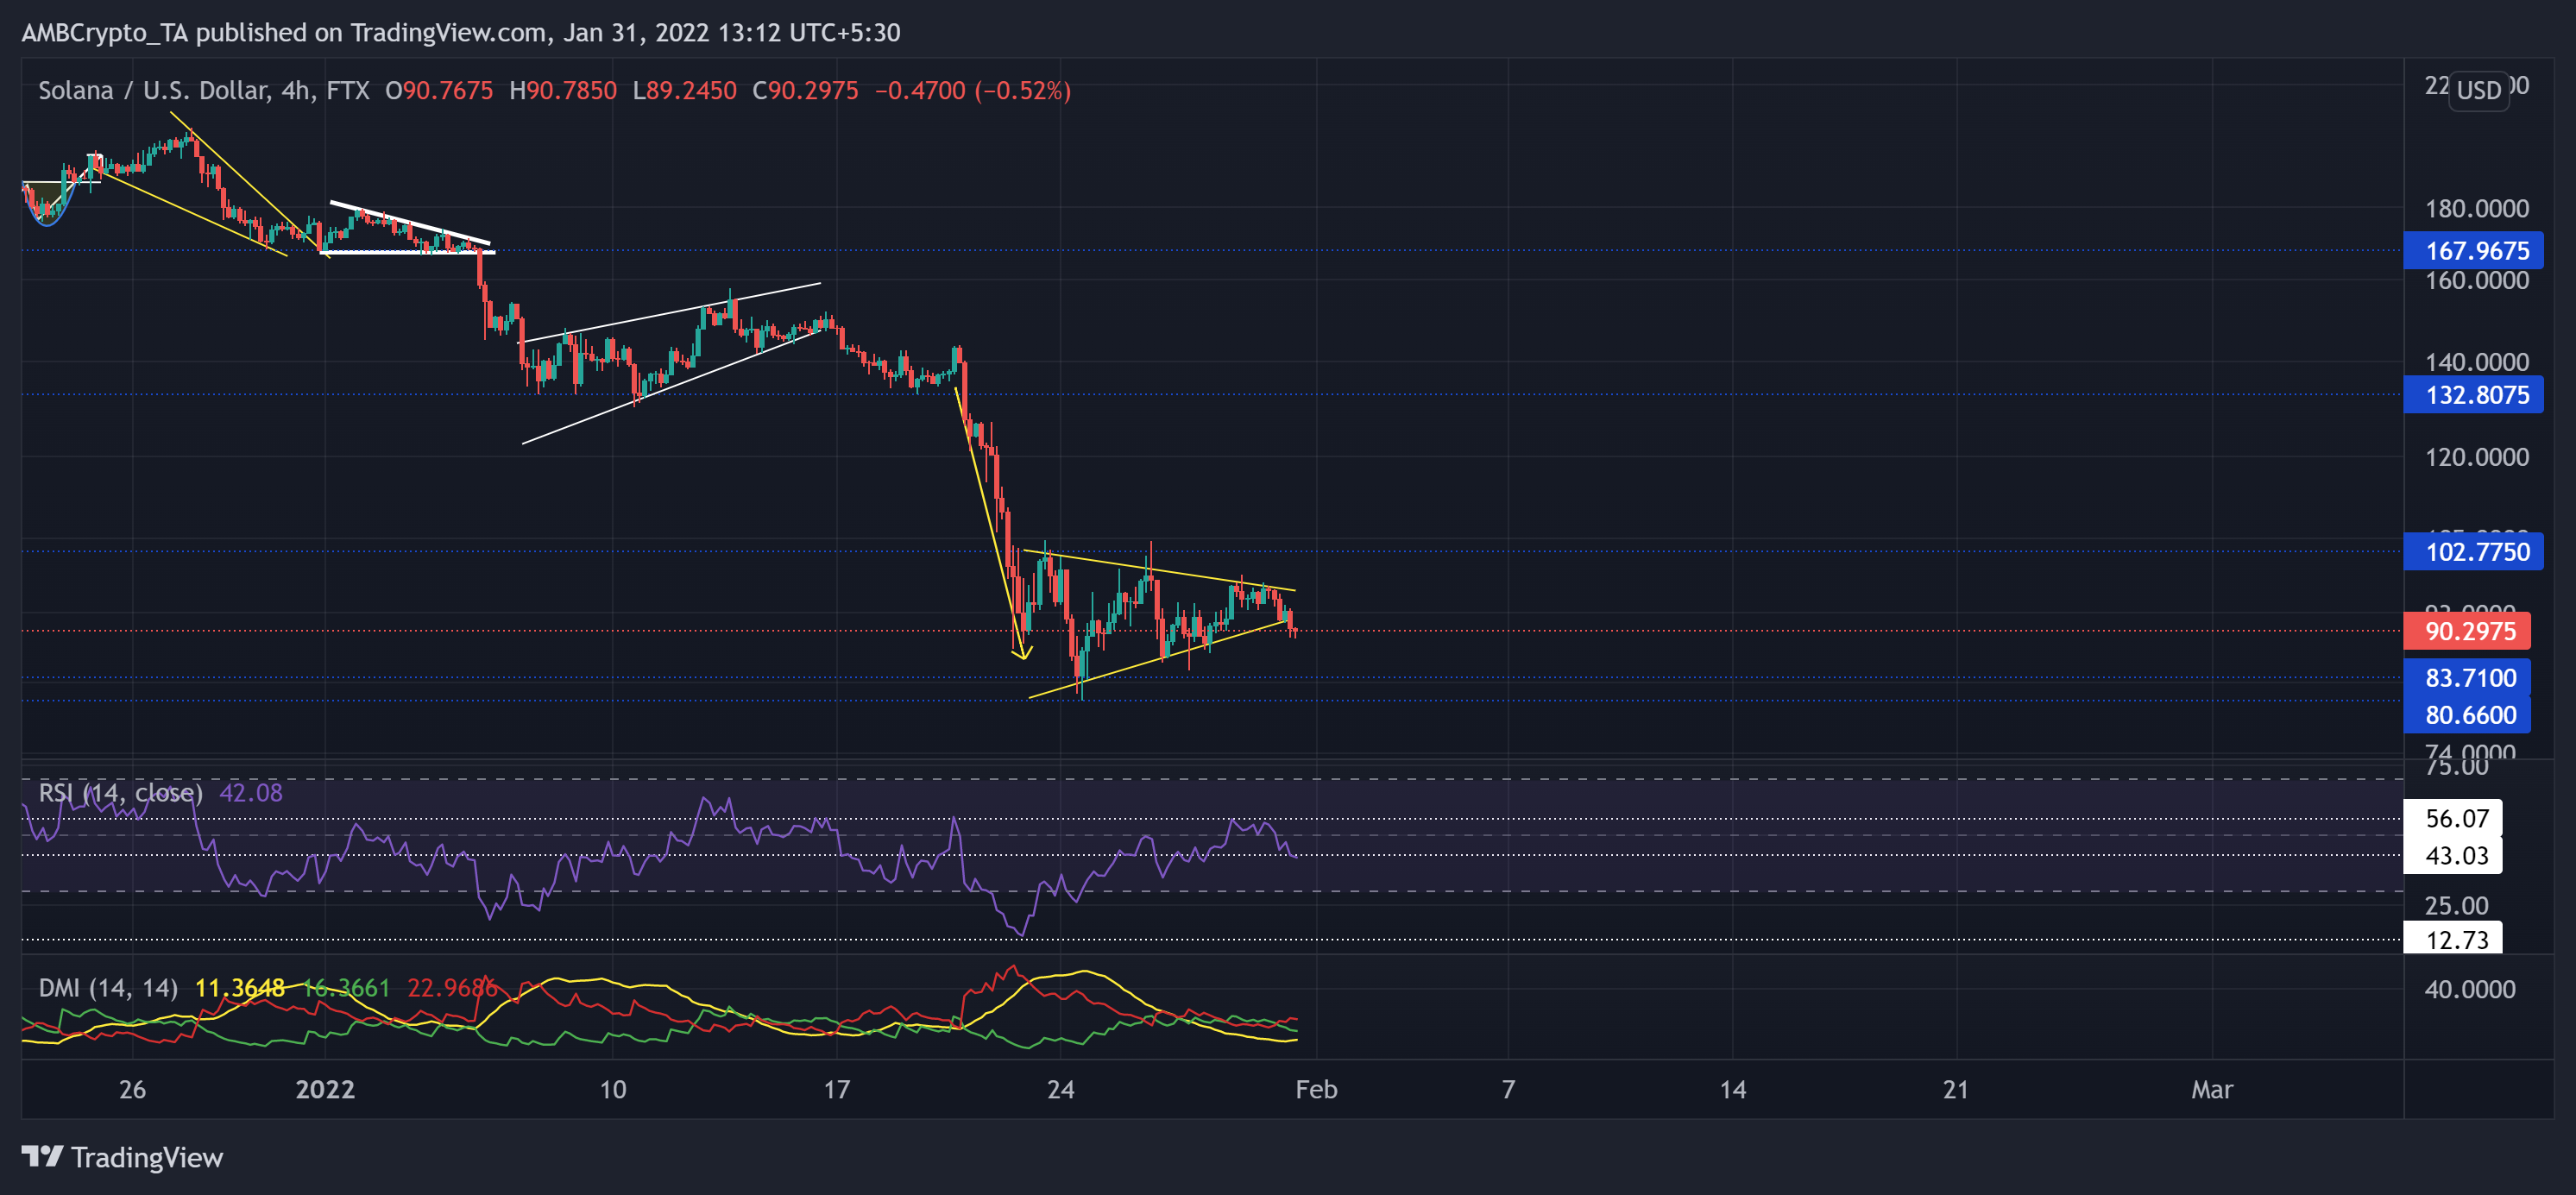
After losing the $167-mark, the bears kept exerting pressure while testing the $132-mark resistance (previous support). The recent sell-off propelled SOL to lose 43.7%of its value (from 21 January) and march toward its five-month low on 24 January.
Over the past few hours, SOL witnessed an expected bearish pennant breakdown on its 4-hour chart. Further retracements from here would find support at the $83.71-mark.
At press time, the altcoin traded at $90.2975. After plunging to its record low, the RSI upturned by 37 points from the oversold territory. But reversed from the 56-mark. With the recent price fall, it also lost the 43-level. Also, the +DI and -DI lines undertook a bearish crossover, the ADX stood weak. This reading entailed a weak directional trend for the altcoin.
Axie Infinity (AXS)
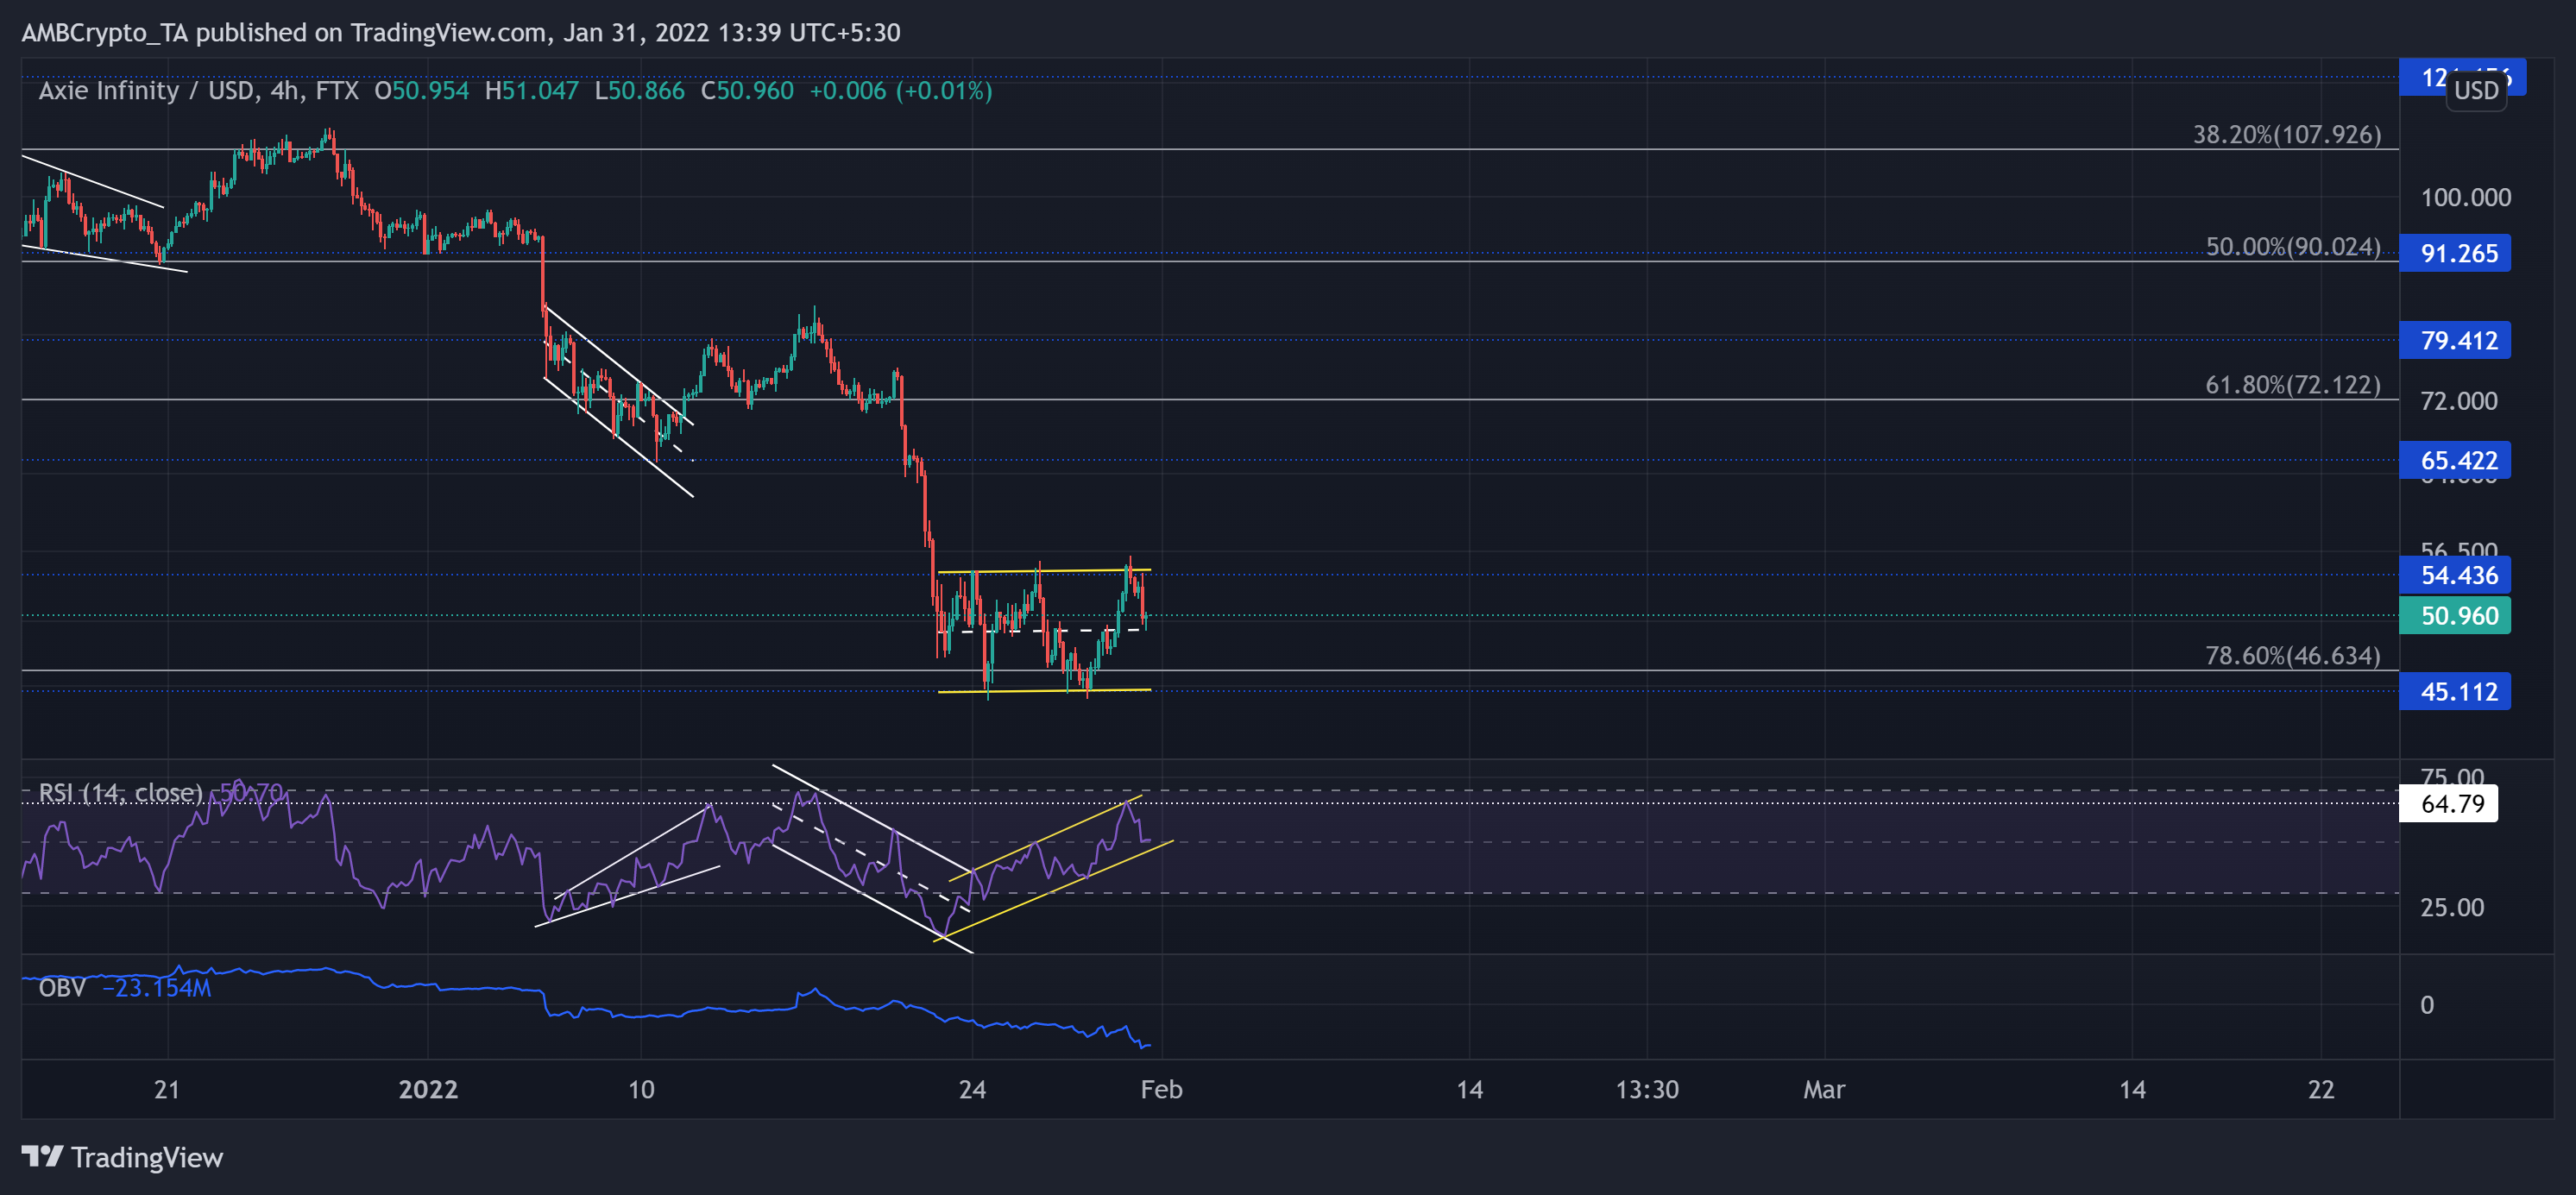
Since striking its ATH on 6 November, AXS has steadily declined and lost multiple resistance levels over the past month. The alt lost more than half of its value (since 5 January) as it rushed south to touch its five-month low on 24 January.
Then, as the bearish vigor prevailed, AXS lost its long-term 61.8% Fibonacci support after the 21 January sell-off. Since then, it saw a side-channel while ensuring the $45.1-mark.
At press time, AXS was at $50.96. The RSI transposed its down-channel into an ascending channel as it reversed from the 64-mark. Any fall below the midline would be detrimental to the recovery phase. Further, the OBV rather saw a steady fall, hinting at increasing bear influence.
AAVE
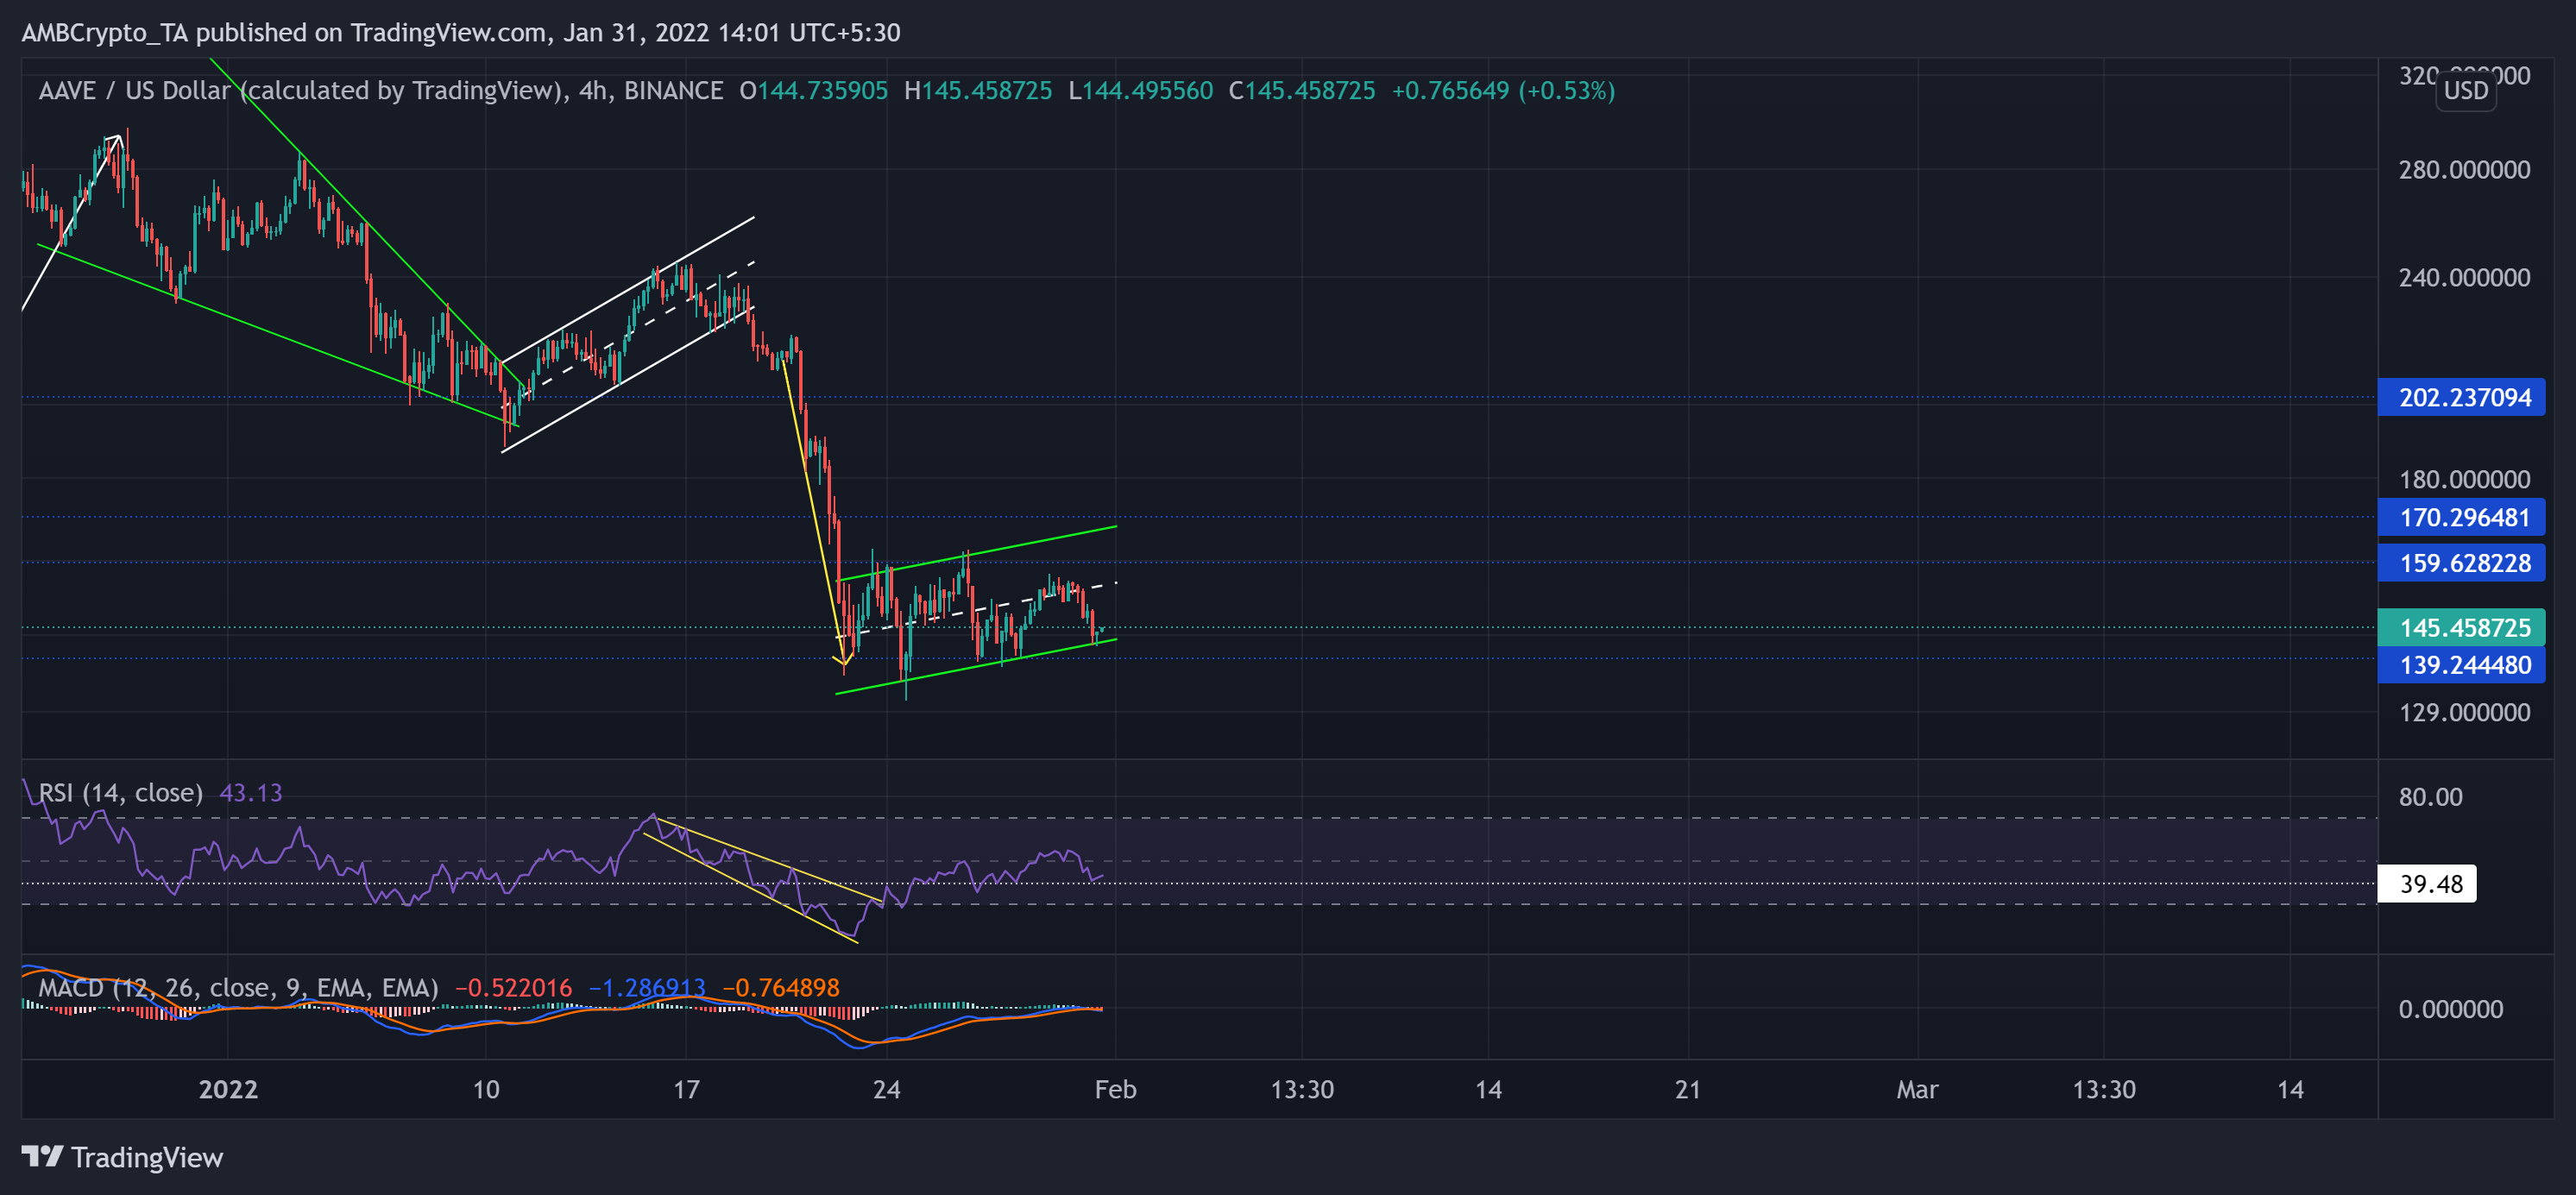
After its up-channel (white) breakdown, bulls lost their edge and even failed to defend the $202-level resistance (previous support). The alt lost over 45.95% (from 16 January) of its value until it poked its year-long low on 24 January.
Since recovering from the $139-level, AAVE formed a bearish flag on its 4-hour chart. The midline of the up-channel (green) still stood as an immediate testing point for bulls.
At press time, AAVE was trading at $145.46. The RSI could not sustain itself above the midline, as it plunged to test the 39-mark after displaying a bearish bias. Also, the MACD lines failed to cross the equilibrium, reiterating the momentum in favor of sellers.