Solana bulls cling to the $20 support but demand was conspicuous by its absence
The rising Open Interest showed bullish sentiment in the shorter timeframes but the price action of the past month leaned in favor of the sellers

Disclaimer: The information presented does not constitute financial, investment, trading, or other types of advice and is solely the writer’s opinion.
- The H12 market structure of SOL was bearish.
- The two resistances overhead can stall the bulls later in May.
Solana [SOL] saw increased network usage after transaction fees heightened on Ethereum [ETH] and Bitcoin [BTC]. Yet, despite the influx of users, other metrics such as TVL were in a downtrend. The prices also followed the same path.
Read Solana’s [SOL] Price Prediction 2023-24
The 4-hour chart showed a strong confluence of resistance at $21.8-$22.5. A move into this zone has a higher chance of facing rejection.
Meanwhile, the $21.33 level also offered stern resistance on the lower timeframes, but sentiment favored the buyers in the short-term.
$21.3 was tested as resistance but the buyers did not display strength
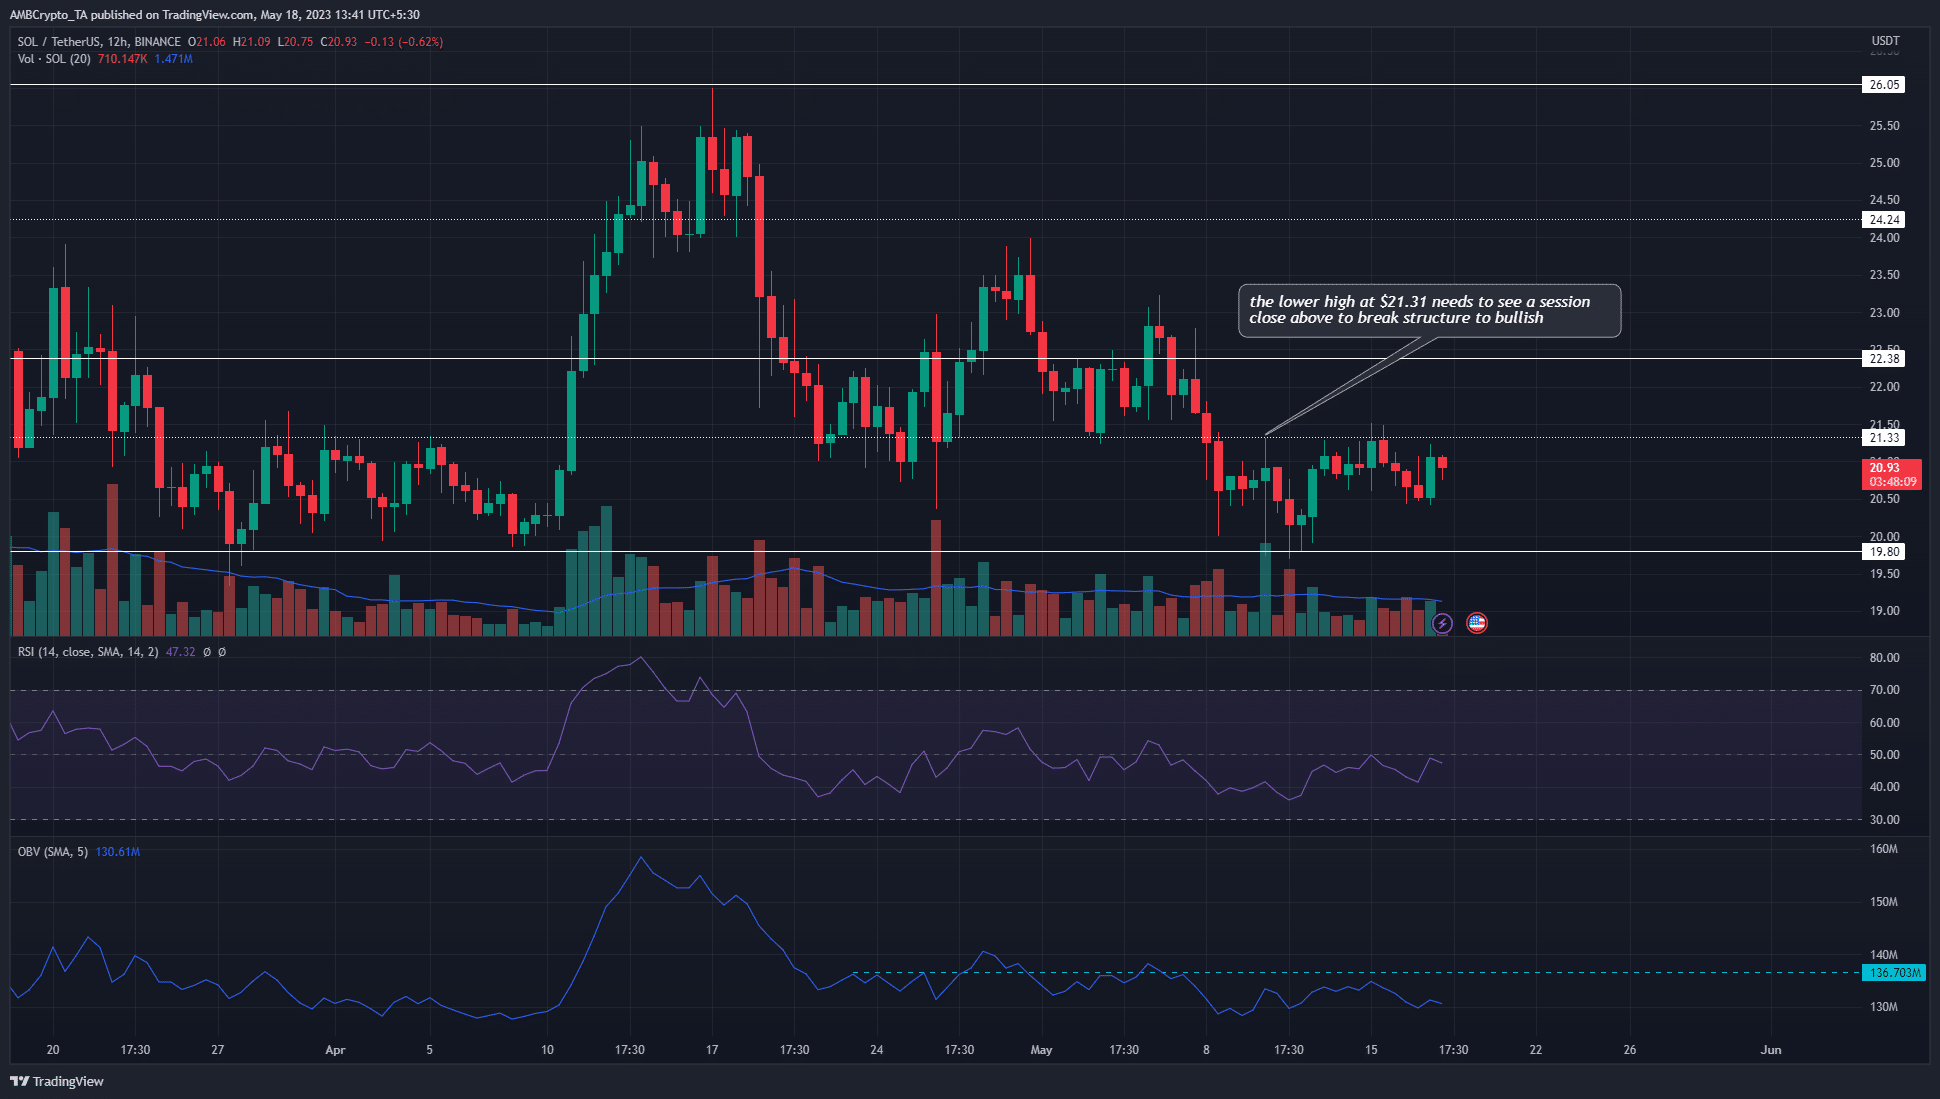
The 12-hour chart showed the market structure was bearish.
On 19 April SOL slipped $23.74, which was the higher low formed in mid-April. Thereafter Solana formed a series of lower highs, reinforcing the idea of a bearish market.
The RSI also fell below neutral 50 and has not crossed 55 since then.
This showed bearish momentum was still in power. Yet, over the past week, Solana saw a bounce from the $20 area, which showed some lower timeframe bullish momentum.
The OBV hinted that despite the bounce, demand was not hefty.
Since 24 April, the OBV has been unable to rise above the resistance level marked on the indicator. The one attempted move on 29 April did not see follow-through from the buyers, and both the OBV and the price sank lower.
At the time of writing, SOL needs to push past the $21.33 level to break the structure to bullish. The OBV needs to follow as well, to add credibility to the upward move. But as things stand, the sellers have the upper hand.
Rising OI showed sentiment has been bullish on the shorter timeframes
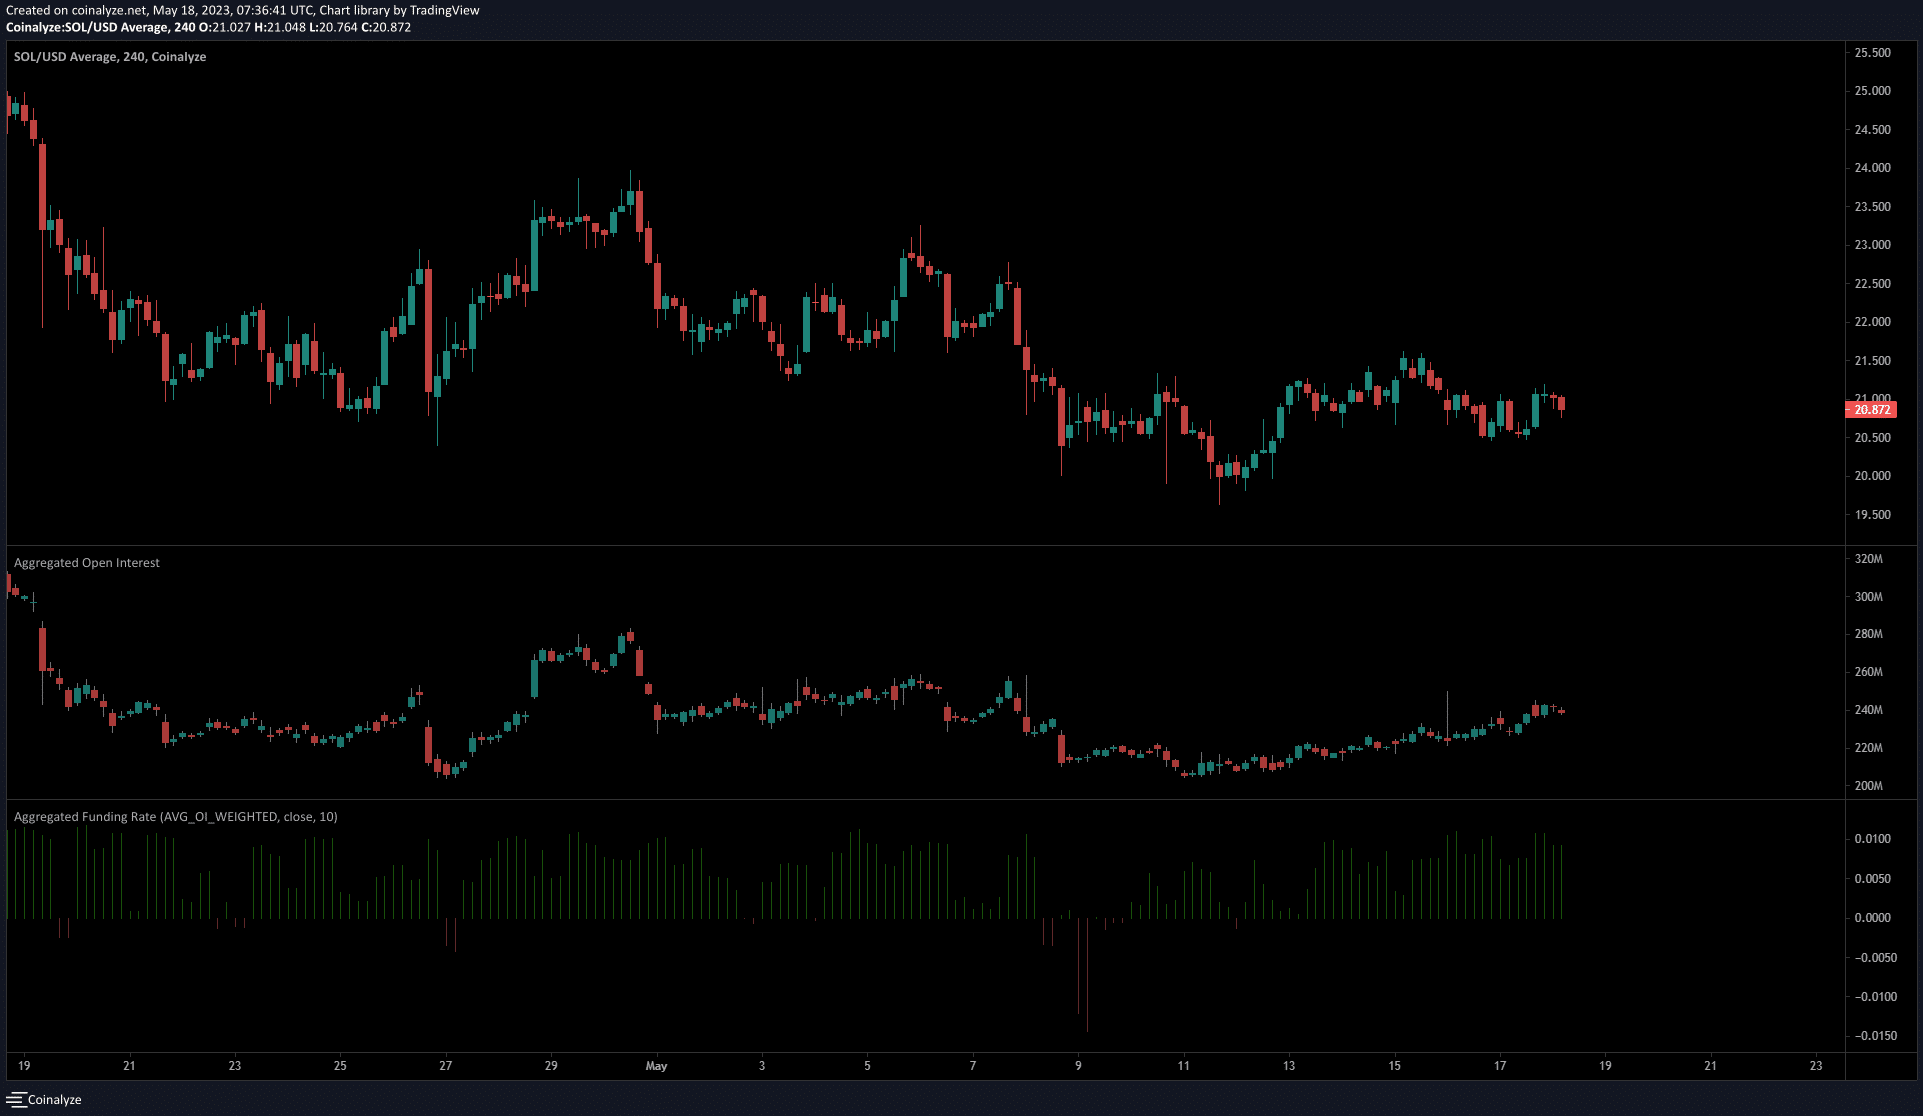
On 7 May, the funding rate fell into negative territory but was quick to climb back above zero. This showed speculators likely hedged short positions when SOL fell to $20, but the sentiment has shifted since then.
How much are 1, 10, or 100 SOL worth today?
Alongside positive funding rates, Open Interest was also on the rise. Solana bounced from $20 to $20.9 and the Open Interest gained just over $35 million.
This showed speculators were willing to bid for the asset and underlined the LTF sentiment was bullish despite the lack of demand reflected on the OBV.